CAT 2018 Slot 1 DILR · Set 5 of 8Data InterpretationEasy DifficultyQ17–Q20 · 4 MCQ

CAT 2018 Slot 1 DILR Set 5: Other Charts (4 Questions) with Solutions

The Other Charts set from the official CAT 2018 Slot 1 DILR paper: the caselet, all 4 questions, the official answer key and a step-by-step solution for each. 100% free, no sign-up.

The Set: Read the Caselet First

CAT 2018 Slot 1 DILR · Questions 17–20
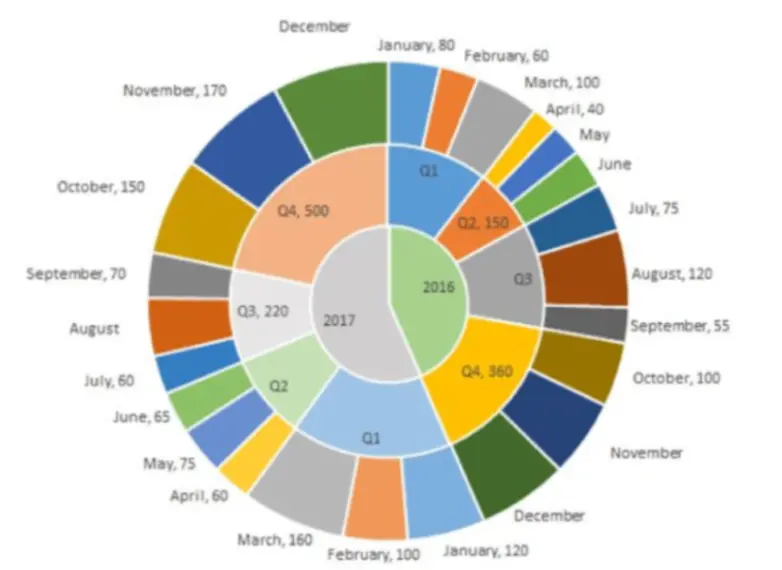
The multi-layered pie-chart below shows the sales of LED television sets for a big retail electronics outlet during 2016 and 2017. The outer layer shows the monthly sales during this period, with each label showing the month followed by sales figure of that month. For some months, the sales figures are not given in the chart. The middle-layer shows quarterwise aggregate sales figures (in some cases, aggregate quarter-wise sales numbers are not given next to the quarter). The innermost layer shows annual sales. It is known that the sales figures during the three months of the second quarter (April, May, June) of 2016 form an arithmetic progression, as do the three monthly sales figures in the fourth quarter (October, November, December) of that year.
Official Reference Chart - CAT 2018 Slot 1 Official Reference Chart - CAT 2018 Slot 1

In the exam this set competed with 7 others for 60 minutes. Budget about 8 minutes if you attempt it.

Q17. Other Charts

MCQ · +3 / −1
What is the percentage increase in sales in December 2017 as compared to the sales in December 2016?
  1. A) 38.46
  2. B) 22.22
  3. C) 28.57
  4. D) 50.00
Correct Answer
C) 28.57
Step-by-step solution
📌 Core Concept
Rebuild the missing monthly figures from the quarter totals and the arithmetic-progression (AP) condition, then compare December 2017 with December 2016.
🔢 Step-by-Step Solution
1
The 2016 Q4 total is 360 and October is 100. Oct, Nov and Dec form an AP, so Nov =360/3=120= 360/3 = 120 (the middle term is the mean). The common difference is 20, so Dec 2016 =140= 140.
2
The 2017 Q4 total is 500, with October 150 and November 170. So Dec 2017 =500−150−170=180= 500 - 150 - 170 = 180.
3
Percentage increase =180−140140×100=40140×100=28.57%= \dfrac{180-140}{140}\times 100 = \dfrac{40}{140}\times 100 = 28.57\%.
Why Not the Others
A) 38.46 would need a base of 130 for December 2016, which the AP does not give.
B) 22.22 is not 40/14040/140.
D) 50.00 would need a December 2016 base of 120, which is the November figure.
Quick Check
140×1.2857=180140 \times 1.2857 = 180.
Correct Answer: C

Q18. Other Charts

MCQ · +3 / −1
In which quarter of 2017 was the percentage increase in sales from the same quarter of 2016 the highest?
  1. A) Q2
  2. B) Q1
  3. C) Q4
  4. D) Q3
Correct Answer
B) Q1
Step-by-step solution
📌 Core Concept
Find each quarter's total for 2016 and 2017, then compare the percentage growth quarter by quarter.
🔢 Step-by-Step Solution
1
The 2016 quarters are Q1 =80+60+100=240= 80+60+100 = 240, Q2 =150= 150 (given), Q3 =75+120+55=250= 75+120+55 = 250 and Q4 =360= 360 (given).
2
For 2017, Q1 =120+100+160=380= 120+100+160 = 380, Q2 =60+75+65=200= 60+75+65 = 200 and Q3 =220= 220 (given). Q4 =500= 500 (given).
3
Growth by quarter:
Q1: 380−240240=58.3%\dfrac{380-240}{240} = 58.3\%
Q2: 200−150150=33.3%\dfrac{200-150}{150} = 33.3\%
Q3: 220<250220 < 250, so sales fell
Q4: 500−360360=38.9%\dfrac{500-360}{360} = 38.9\%
4
Q1 has the highest increase, at about 58.3%.
Why Not the Others
A) Q2 grew only 33.3%.
C) Q4 grew 38.9%, which is less than Q1.
D) Q3 declined.
Correct Answer: B

Q19. Other Charts

MCQ · +3 / −1
During which quarter was the percentage decrease in sales from the previous quarter’s sales the highest?
  1. A) Q2 of 2017
  2. B) Q4 of 2017
  3. C) Q2 of 2016
  4. D) Q1 of 2017
Correct Answer
A) Q2 of 2017
Step-by-step solution
📌 Core Concept
Compute the quarter totals for both years, then find the percentage change from each quarter to the one before it. Only the quarters named in the options need checking.
🔢 Step-by-Step Solution
1
The 2016 totals are Q1 =240= 240, Q2 =150= 150, Q3 =250= 250 and Q4 =360= 360. The 2017 totals are Q1 =380= 380, Q2 =200= 200, Q3 =220= 220 and Q4 =500= 500.
2
Q1 2017 against Q4 2016: 360→380360 \to 380, an increase, so it is not a decrease.
3
Q2 2017 against Q1 2017: 380−200380=47.4%\dfrac{380-200}{380} = 47.4\% decrease.
4
Q4 2017 against Q3 2017: 220→500220 \to 500, an increase, so it is not a decrease.
5
Q2 2016 against Q1 2016: 240−150240=37.5%\dfrac{240-150}{240} = 37.5\% decrease.
6
The largest decrease is 47.4%, in Q2 of 2017.
Why Not the Others
B) Q4 of 2017 rose sharply.
C) Q2 of 2016 fell only 37.5%.
D) Q1 of 2017 rose.
Correct Answer: A

Q20. Other Charts

MCQ · +3 / −1
During which month was the percentage increase in sales from the previous month’s sales the highest?
  1. A) March of 2017
  2. B) October of 2017
  3. C) March of 2016
  4. D) October of 2016
Correct Answer
B) October of 2017
Step-by-step solution
📌 Core Concept
Compare the month-on-month percentage rise for each month listed. The base month is small in some cases, which makes the rise large.
🔢 Step-by-Step Solution
1
March 2017 against February 2017: 160−100100=60%\dfrac{160-100}{100} = 60\%.
2
October 2017 against September 2017: September is 70 and October is 150, so 150−7070=114.3%\dfrac{150-70}{70} = 114.3\%.
3
March 2016 against February 2016: 100−6060=66.7%\dfrac{100-60}{60} = 66.7\%.
4
October 2016 against September 2016: 100−5555=81.8%\dfrac{100-55}{55} = 81.8\%.
5
The highest rise is 114.3%, in October 2017.
Why Not the Others
A) March 2017 rose 60%.
C) March 2016 rose 66.7%.
D) October 2016 rose 81.8%.
Correct Answer: B
Timed Practice

Attempt the full CAT 2018 Slot 1 paper as a free mock

All three sections, 180 minutes, in the TCS iON-style simulator. Free, no sign-up.

Start Free Mock

CAT 2018 Slot 1 DILR at a Glance

Sets in this section8
Questions in this section32
Section time60 minutes
Convenor IIMIIM Calcutta

More CAT DILR Sets with Solutions