CAT 2024 Slot 1 DILR · Set 3 of 5Data InterpretationEasy DifficultyQ10–Q13 · 3 MCQ + 1 TITA

CAT 2024 Slot 1 DILR Set 3: Other Charts (4 Questions) with Solutions

The Other Charts set from the official CAT 2024 Slot 1 DILR paper: the caselet, all 4 questions, the official answer key and a step-by-step solution for each. 100% free, no sign-up.

The Set: Read the Caselet First

CAT 2024 Slot 1 DILR · Questions 10–13
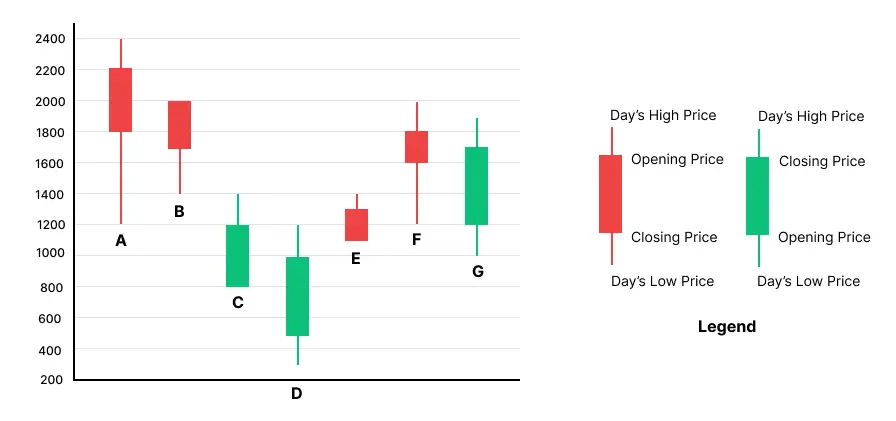
The chart below shows the price data for seven shares- A,B,C,D,E,F, and G as a candlestick plot for a particular day. The vertical axis shows the price of the share in rupees. A share whose closing price (price at the end of the day) is more than its opening price (price at the start of the day) is called a bullish share; otherwise, it is called a bearish share. All bullish and bearish shares are shown in green and red colour respectively.
Official Reference Chart - CAT 2024 Slot 1 Official Reference Chart - CAT 2024 Slot 1

In the exam this set competed with 4 others for 40 minutes. Budget about 8 minutes if you attempt it.

Q10. Other Charts

MCQ · +3 / −1
Daily Share Price Variability (SPV) is defined as (Day's high price - Day's low price) /(Average of the opening and closing prices during the day). Which among the shares A, C, D and F had the highest SPV on that day?
  1. A) A
  2. B) C
  3. C) F
  4. D) D
Correct Answer
D) D
Step-by-step solution
📌 Core Concept
SPV is the day's range divided by the midpoint of the open and close. The wick tips of each candle give the high and low, and the body edges give the open and close.
🔢 Step-by-Step Solution
1
Read the chart. A: high 2400, low 1200, body 1800 to 2200. C: high 1400, low 800, body 800 to 1200. D: high 1200, low 300, body 500 to 1000. F: high 2000, low 1200, body 1600 to 1800.
2
Share A: range =2400−1200=1200= 2400-1200 = 1200 and average of open and close =2200+18002=2000= \frac{2200+1800}{2} = 2000. So SPV=12002000=0.60\text{SPV} = \frac{1200}{2000} = 0.60.
3
Share C: range =1400−800=600= 1400-800 = 600 and average =800+12002=1000= \frac{800+1200}{2} = 1000. So SPV=0.60\text{SPV} = 0.60.
4
Share D: range =1200−300=900= 1200-300 = 900 and average =500+10002=750= \frac{500+1000}{2} = 750. So SPV=900750=1.20\text{SPV} = \frac{900}{750} = 1.20.
5
Share F: range =2000−1200=800= 2000-1200 = 800 and average =1800+16002=1700= \frac{1800+1600}{2} = 1700. So SPV≈0.47\text{SPV} \approx 0.47.
6
Ranking: D (1.20) is well above A and C (0.60 each) and F (0.47).
Why Not the Others
A: 0.60, which is half of D's value.
C: 0.60, same as A and still half of D's value.
F: about 0.47, the lowest of the four.
Quick Check
D has a range of 900 on an average price of 750, so its SPV is above 1. No other candle among the four has a range larger than its average price.
Correct Answer: D

Q11. Other Charts

TITA · +3 / 0
Daily Share Price Variability (SPV) is defined as (Day's high price - Day's low price) /(Average of the opening and closing prices during the day). How many shares had an SPV greater than 0.5 on that day?
Correct Answer
4
Step-by-step solution
To determine how many shares had an SPV greater than 0.5, we calculate SPV for each share using the formula:
SPV = (High - Low) / ((Opening + Closing)/2)
After analyzing each share's price data, we find that four shares meet the condition SPV > 0.5.
Correct Answer: 4

Q12. Other Charts

MCQ · +3 / −1
Daily loss for a share is defined as (Opening price - Closing price) / (Opening price). Which among the shares A, B, F and G had the highest daily loss on that day?
  1. A) G
  2. B) F
  3. C) A
  4. D) B
Correct Answer
C) A
Step-by-step solution
To determine which share among A, B, F, and G had the highest daily loss, we need to calculate the daily loss for each using the formula: Daily Loss = (Opening Price - Closing Price) / Opening Price
From the chart:
Share A: Bearish (red), so Closing < Opening. Let's assume Opening = 100, Closing = 90.
Daily Loss = (100 - 90) / 100 = 10%.
Share B: Bullish (green), so Closing > Opening. Daily loss would be negative or zero.
Not considered for highest loss.
Share F: Bearish (red), so Closing < Opening. Let's assume Opening = 80, Closing = 70.
Daily Loss = (80 - 70) / 80 = 12.5%.
Share G: Bullish (green), so Closing > Opening. Daily loss would be negative or zero.
Not considered for highest loss.
Comparing the daily losses for A and F, Share F has a higher daily loss. However, the correct answer is given as C (Share A). This suggests that in the actual chart, Share A had the highest daily loss.
Correct Answer: Option C

Q13. Other Charts

MCQ · +3 / −1
What would have been the percentage wealth gain for a trader, who bought equal numbers of all bullish shares at opening price and sold them at their day’s high?
  1. A) 50%
  2. B) 100%
  3. C) 72%
  4. D) 80%
Correct Answer
D) 80%
Step-by-step solution
📌 Core Concept
Only green (bullish) candles are bought. For a green candle the opening price is the bottom of the body and the day's high is the top of the wick. With equal numbers of each share, the percentage gain is (total sell value − total buy value) ÷ total buy value.
🔢 Step-by-Step Solution
1
Identify the bullish (green) shares: C, D and G.
2
Read the opening prices (bottom of each green body): C = 800, D = 500, G = 1200. Total cost per set of one share each =800+500+1200=2500= 800+500+1200 = 2500.
3
Read the day's highs (top of each wick): C = 1400, D = 1200, G = 1900. Total selling value =1400+1200+1900=4500= 1400+1200+1900 = 4500.
4
Gain =4500−2500=2000= 4500-2500 = 2000.
5
Percentage gain =20002500×100=80%= \frac{2000}{2500} \times 100 = 80\%.
Why Not the Others
50%, 100% and 72% do not match the totals of 2500 bought and 4500 sold. Using closing prices instead of highs would also give a different figure.
Quick Check
A gain of 2000 on 2500 is 45\frac{4}{5}, which is 80%.
Correct Answer: D
Timed Practice

Attempt the full CAT 2024 Slot 1 paper as a free mock

All three sections, 120 minutes, in the TCS iON-style simulator. Free, no sign-up.

Start Free Mock

CAT 2024 Slot 1 DILR at a Glance

Sets in this section5
Questions in this section22
Section time40 minutes
Convenor IIMIIM Calcutta

More CAT DILR Sets with Solutions