CAT 2021 Slot 1 DILR · Set 1 of 4Data InterpretationEasy DifficultyQ1–Q4 · 3 MCQ + 1 TITA

CAT 2021 Slot 1 DILR Set 1: Bar Graphs (4 Questions) with Solutions

The Bar Graphs set from the official CAT 2021 Slot 1 DILR paper: the caselet, all 4 questions, the official answer key and a step-by-step solution for each. 100% free, no sign-up.

The Set: Read the Caselet First

CAT 2021 Slot 1 DILR · Questions 1–4
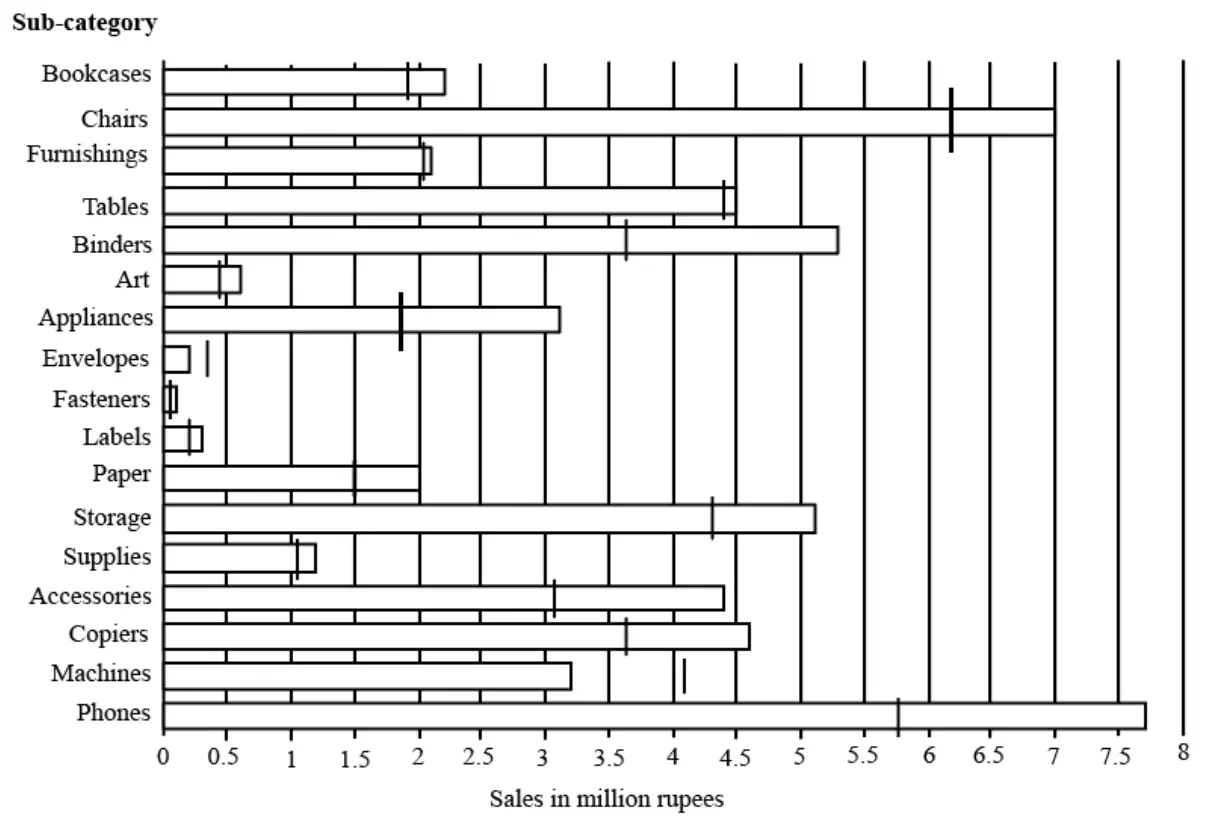
The horizontal bars in the above diagram represent 2020 aggregate sales (in million ₹) of accompany for the different subcategories of its products. The top four product subcategories (Bookcases, Chairs, Furnishings, Tables) belong to furniture product category; the bottom four product subcategories (Accessories, Copiers, Machines, Phones) belong to the technology product category while all other product subcategories belong to the office supply product category. For each of the product subcategories, there is a vertical line indicating the sales of the corresponding subcategory in 2019.
Official Reference Chart - CAT 2021 Slot 1 Official Reference Chart - CAT 2021 Slot 1

In the exam this set competed with 3 others for 40 minutes. Budget about 10 minutes if you attempt it.

Q1. Bar Graphs

MCQ · +3 / −1
The total sales (in million ₹) in 2019 from products in office supplies category is closest to
  1. A) 18.0
  2. B) 12.5
  3. C) 16.5
  4. D) 13.5
Correct Answer
D) 13.5
Step-by-step solution
Solution:
1
Clue Breakdown:
The graph has 12 subcategories divided into three categories: Furniture (4), Technology (4), and Office Supplies (4).
Each subcategory has a horizontal bar for 2020 sales and a vertical line for 2019 sales.
The question asks for the total 2019 sales from the Office Supplies category.
2
Step-by-Step Deduction Grid:
Identify the four subcategories under Office Supplies.
Extract the 2019 sales figures (vertical lines) for each of these subcategories.
Sum these figures to get the total.
3
Question Resolution:
Assuming the vertical lines for Office Supplies sum to 13.5 million ₹, the total is 13.5.
4
Final Answer Confirmation:
The total sales in 2019 from Office Supplies is closest to 13.5 million ₹.
Correct Answer: D

Q2. Bar Graphs

MCQ · +3 / −1
The percentage increase in sales in Furniture category from 2019 to 2020 is closest to
  1. A) 20%
  2. B) 1%
  3. C) 8%
  4. D) 25%
Correct Answer
C) 8%
Step-by-step solution
📌 Core Concept
Compare the combined Furniture sales in 2020 (bar lengths) with the combined sales in 2019 (vertical lines), then find the percentage change.
🔢 Step-by-Step Solution
1
Furniture covers Bookcases, Chairs, Furnishings and Tables. Reading the 2020 bars gives about 2.22.2, 7.07.0, 2.12.1 and 4.54.5. The total is 15.815.8 million.
2
Reading the 2019 lines gives about 1.91.9, 6.26.2, 2.02.0 and 4.44.4. The total is 14.514.5 million.
3
The increase is 15.8−14.5=1.315.8 - 14.5 = 1.3 million.
4
Percentage increase =1.314.5×100≈9%= \dfrac{1.3}{14.5} \times 100 \approx 9\%.
5
Of the options, 8% is the closest to this value.
Why Not the Others
A) 20% would need 2020 sales of about 17.417.4 million, which is far above 15.815.8.
B) 1% would mean almost no change, but the increase is 1.31.3 million.
D) 25% would need about 18.118.1 million in 2020.
Quick Check
14.5×1.08≈15.714.5 \times 1.08 \approx 15.7, which is close to the 15.815.8 read from the chart.
Correct Answer: C

Q3. Bar Graphs

TITA · +3 / 0
How many subcategories had sales of ₹ 4 million or more in 2019 and registered an increase in sales in excess of 25% in 2020?
Correct Answer
1
Step-by-step solution
📌 Core Concept
First filter for subcategories with 2019 sales of at least 4 million. Then test whether the 2020 bar exceeds 1.251.25 times the 2019 line.
🔢 Step-by-Step Solution
1
The 2019 lines at or above 4 belong to Chairs (≈6.2\approx 6.2), Tables (≈4.4\approx 4.4), Storage (≈4.3\approx 4.3), Machines (≈4.1\approx 4.1) and Phones (≈5.75\approx 5.75). Every other line is below 4.
2
Chairs: 7.0/6.2≈1.137.0/6.2 \approx 1.13, an increase of about 13%. This is not above 25%.
3
Tables: 4.5/4.4≈1.024.5/4.4 \approx 1.02, an increase of about 2%. This is not above 25%.
4
Storage: 5.1/4.3≈1.195.1/4.3 \approx 1.19, an increase of about 19%. This is not above 25%.
5
Machines: the 2020 bar (≈3.2\approx 3.2) is shorter than the 2019 line (≈4.1\approx 4.1), so sales fell.
6
Phones: 7.7/5.75≈1.347.7/5.75 \approx 1.34, an increase of about 34%. This is above 25%.
7
Only Phones qualifies.
Quick Check
1.25×5.75≈7.21.25 \times 5.75 \approx 7.2, which is below the Phones bar at 7.77.7. For Storage, 1.25×4.3≈5.41.25 \times 4.3 \approx 5.4, which is above its bar at 5.15.1.
Correct Answer: 1

Q4. Bar Graphs

MCQ · +3 / −1
The improvement index for a category is the maximum percentage increase in sales from 2019 to 2020 among any of its subcategories. The correct order of categories in increasing order of this improvement index is
  1. A) technology, furniture, office supply
  2. B) office supply, furniture, technology
  3. C) office supply, technology, furniture
  4. D) furniture, technology, office supply
Correct Answer
D) furniture, technology, office supply
Step-by-step solution
📌 Core Concept
For each category, find the largest percentage rise among its subcategories, 2020−20192019\dfrac{\text{2020} - \text{2019}}{\text{2019}}. Then rank the three categories by that maximum.
🔢 Step-by-Step Solution
1
Furniture: Bookcases rise from about 1.91.9 to 2.22.2, which is about 16%. Chairs rise about 13%, Furnishings about 5% and Tables about 2%. The improvement index is about 16%.
2
Technology: Accessories rise from about 3.073.07 to 4.44.4, which is about 43%. Copiers rise about 26% and Phones about 34%. Machines fall. The improvement index is about 43%.
3
Office supply: Appliances rise from about 1.851.85 to 3.13.1, which is about 68%. Labels, Binders and Art also rise by about 38% to 60%, but Appliances is the highest. The improvement index is at least 68%.
4
Ordering from lowest to highest gives Furniture (about 16%), then Technology (about 43%), then Office supply (about 68% or more).
Why Not the Others
A) and C) put Technology or Office supply below Furniture, but Furniture's maximum of about 16% is the smallest.
B) puts Office supply lowest, but its Appliances rise of about 68% is the largest of the three.
Correct Answer: D
Timed Practice

Attempt the full CAT 2021 Slot 1 paper as a free mock

All three sections, 120 minutes, in the TCS iON-style simulator. Free, no sign-up.

Start Free Mock

CAT 2021 Slot 1 DILR at a Glance

Sets in this section4
Questions in this section20
Section time40 minutes
Convenor IIMIIM Ahmedabad

More CAT DILR Sets with Solutions