CAT 2022 Slot 3 DILR · Set 2 of 4Data InterpretationEasy DifficultyQ6–Q10 · 3 MCQ + 2 TITA

CAT 2022 Slot 3 DILR Set 2: Bar Graphs (5 Questions) with Solutions

The Bar Graphs set from the official CAT 2022 Slot 3 DILR paper: the caselet, all 5 questions, the official answer key and a step-by-step solution for each. 100% free, no sign-up.

The Set: Read the Caselet First

CAT 2022 Slot 3 DILR · Questions 6–10
In the following, a year corresponds to 1st of January of that year.
A study to determine the mortality rate for a disease began in 1980. The study chose 1000 males and 1000 females and followed them for forty years or until they died, whichever came first. The 1000 males chosen in 1980 consisted of 250 each of ages 10 to less than 20, 20 to less than 30, 30 to less than 40, and 40 to less than 50. The 1000 females chosen in 1980 also consisted of 250 each of ages 10 to less than 20, 20 to less than 30, 30 to less than 40, and 40 to less than 50.
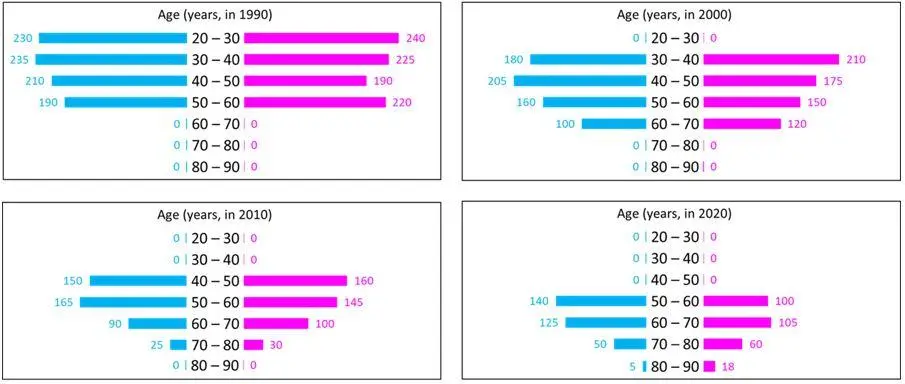
The four figures below depict the age profile of those among the 2000 individuals who were still alive in 1990, 2000, 2010, and 2020. The blue bars in each figure represent the number of males in each age group at that point in time, while the pink bars represent the number of females in each age group at that point in time. The numbers next to the bars give the exact numbers being represented by the bars. For example, we know that 230 males among those tracked and who were alive in 1990 were aged between 20 and 30.
Official Reference Chart - CAT 2022 Slot 3 Official Reference Chart - CAT 2022 Slot 3

In the exam this set competed with 3 others for 40 minutes. Budget about 10 minutes if you attempt it.

Q6. Bar Graphs

MCQ · +3 / −1
In 2000, what was the ratio of the number of dead males to dead females among those being tracked?
  1. A) 41: 43
  2. B) 71: 69
  3. C) 129: 131
  4. D) 109: 107
Correct Answer
B) 71: 69
Step-by-step solution
📌 Core Concept
People dead in a year = 1000 starting individuals of that sex minus those still alive in that year. Only the 2000 chart is needed.
🔢 Step-by-Step Solution
1
Males alive in 2000 (blue bars): 180+205+160+100=645180 + 205 + 160 + 100 = 645.
2
Males dead by 2000: 1000−645=3551000 - 645 = 355.
3
Females alive in 2000 (pink bars): 210+175+150+120=655210 + 175 + 150 + 120 = 655.
4
Females dead by 2000: 1000−655=3451000 - 655 = 345.
5
Ratio of dead males to dead females: 355:345=71:69355 : 345 = 71 : 69.
Why Not the Others
A) 41:4341:43 is not equal to 355:345355:345.
C) 129:131129:131 would need females to be the larger group, but more males died.
D) 109:107109:107 does not reduce from 355:345355:345.
Quick Check
Survivors total 645+655=1300645 + 655 = 1300, so 700700 died, and 355+345=700355 + 345 = 700.
Correct Answer: B

Q7. Bar Graphs

MCQ · +3 / −1
How many people who were being tracked and who were between 30 and 40 years of age in 1980 survived until 2010?
  1. A) 190
  2. B) 110
  3. C) 310
  4. D) 90
Correct Answer
A) 190
Step-by-step solution
📌 Core Concept
A person's age rises by 30 between 1980 and 2010, so the 1980 age group maps to a shifted age group in the 2010 chart.
🔢 Step-by-Step Solution
1
Those aged 30 to 40 in 1980 are aged 60 to 70 in 2010, since 1980+30=20101980 + 30 = 2010.
2
In the 2010 chart, the 60-70 bar shows 90 males and 100 females.
3
Survivors to 2010: 90+100=19090 + 100 = 190.
Why Not the Others
B) 110 is not the sum of the 60-70 bars.
C) 310 adds the 50-60 bars (165+145165 + 145), which are the people aged 20 to 30 in 1980.
D) 90 counts only the males.
Correct Answer: A

Q8. Bar Graphs

MCQ · +3 / −1
How many individuals who were being tracked and who were less than 30 years of age in 1980 survived until 2020?
  1. A) 230
  2. B) 580
  3. C) 470
  4. D) 240
Correct Answer
C) 470
Step-by-step solution
📌 Core Concept
People aged under 30 in 1980 are aged 10 to 30. Forty years later, in 2020, they are aged 50 to 70.
🔢 Step-by-Step Solution
1
The 10-20 group of 1980 is aged 50-60 in 2020. The 20-30 group of 1980 is aged 60-70 in 2020.
2
2020 males: 50-60 gives 140 and 60-70 gives 125, a total of 265.
3
2020 females: 50-60 gives 100 and 60-70 gives 105, a total of 205.
4
Total: 265+205=470265 + 205 = 470.
Why Not the Others
A) 230 is not the sum of these four bars.
B) 580 adds extra age groups beyond 50-70.
D) 240 is not the sum of these four bars.
Correct Answer: C

Q9. Bar Graphs

TITA · +3 / 0
How many of the males who were being tracked and who were between 20 and 30 years of age in 1980 died in the period 2000 to 2010?
Correct Answer
40
Step-by-step solution
📌 Core Concept
Track the male cohort aged 20 to 30 in 1980 through the charts. Its age group moves up 10 years with every chart.
🔢 Step-by-Step Solution
1
In 1990 this cohort is aged 30-40, in 2000 aged 40-50, and in 2010 aged 50-60.
2
Males alive in 2000 in the 40-50 bar:
205
3. Males alive in 2010 in the 50-60 bar:
165
4. Deaths between 2000 and 2010: 205−165=40205 - 165 = 40.
Quick Check
The other age groups cannot supply this figure, because only this cohort's own bars can be compared across 2000 and 2010.
Correct Answer: 40

Q10. Bar Graphs

TITA · +3 / 0
How many of the females who were being tracked and who were between 20 and 30 years of age in 1980 died between the ages of 50 and 60?
Correct Answer
30
Step-by-step solution
📌 Core Concept
Track the female cohort aged 20 to 30 in 1980 through the charts. The decade in which the cohort moves from the 40-50 band to the 50-60 band is the decade of deaths at ages 50 to 60.
🔢 Step-by-Step Solution
1
In 1990 this cohort is aged 30-40 (225 females). In 2000 it is aged 40-50 (175 females). In 2010 it is aged 50-60 (145 females).
2
The cohort enters the 50-60 band between 2000 and 2010, and the 2010 chart shows it in that band.
3
Deaths in this decade: 175−145=30175 - 145 = 30.
Quick Check
The cohort count falls from 225 to 175 to 145, so the decade drops are 50 and 30, and the 30 is the one matching the 50-60 band.
Correct Answer: 30
Timed Practice

Attempt the full CAT 2022 Slot 3 paper as a free mock

All three sections, 120 minutes, in the TCS iON-style simulator. Free, no sign-up.

Start Free Mock

CAT 2022 Slot 3 DILR at a Glance

Sets in this section4
Questions in this section20
Section time40 minutes
Convenor IIMIIM Bangalore

More CAT DILR Sets with Solutions