CAT 2024 Slot 3 DILR · Set 2 of 5Data InterpretationEasy DifficultyQ6–Q9 · 4 MCQ

CAT 2024 Slot 3 DILR Set 2: Bar Graphs (4 Questions) with Solutions

The Bar Graphs set from the official CAT 2024 Slot 3 DILR paper: the caselet, all 4 questions, the official answer key and a step-by-step solution for each. 100% free, no sign-up.

The Set: Read the Caselet First

CAT 2024 Slot 3 DILR · Questions 6–9
Over the top (OTT) subscribers of a platform are segregated into three categories:
i
Kid, ii) Elder, and iii) Others.
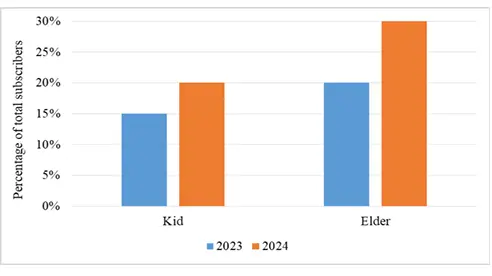
Some of the subscribers used one app and the others used multiple apps to access the platform. The figure below shows a bar graph representing the percentage of the total number of subscribers in 2023 and 2024 who belong to the 'Kid' and 'Elder' categories.
The following additional facts are known about the number of subscribers.
1
The total number of subscribers increased by 10% from 2023 to 2024.
2
In 2024, 1/2 of the subscribers from the ‘Kid' category and 2/3 of the subscribers from the 'Elder' category subscribers use one app.
3
In 2023, the number of subscribers from the 'Kid' category who used multiple apps was the same as the number of subscribers from the 'Elder' category who used one app.
4
10,000 subscribers from the 'Kid' category used one app and 15,000 subscribers from the 'Elder' category used multiple apps in 2023.
Official Reference Chart - CAT 2024 Slot 3 Official Reference Chart - CAT 2024 Slot 3

In the exam this set competed with 4 others for 40 minutes. Budget about 8 minutes if you attempt it.

Q6. Bar Graphs

MCQ · +3 / −1
How many subscribers belonged to the ‘Others' category in 2024?
  1. A) 45000
  2. B) 55000
  3. C) Cannot be determined
  4. D) 65000
Correct Answer
B) 55000
Step-by-step solution
📌 Core Concept
The 2023 data fix the total number of subscribers. The 2024 total and the Kid and Elder shares then give the 'Others' count.
🔢 Step-by-Step Solution
1
From the bar graph, Kid is 15 percent of the total in 2023 and 20 percent in 2024. Elder is 20 percent in 2023 and 30 percent in 2024.
2
Let the 2023 total be TT. Let xx be the number of 2023 Kid subscribers using multiple apps. Fact 3 says this equals the number of 2023 Elder subscribers using one app.
3
Kid in 2023 = 10000 (one app, fact 4) + xx (multiple apps) = 15 percent of TT.
4
Elder in 2023 = xx (one app, fact 3) + 15000 (multiple apps, fact 4) = 20 percent of TT.
5
Subtracting step 3 from step 4 gives 5000=0.05T5000 = 0.05T, so T=100000T = 100000. Then x=5000x = 5000.
6
Fact 1 gives the 2024 total as 100000⋅1.10=110000100000 \cdot 1.10 = 110000.
7
In 2024, Kid and Elder together are 20+30=5020 + 30 = 50 percent of 110000, which is 55000.
8
Others in 2024 are 110000−55000=55000110000 - 55000 = 55000.
Why Not the Others
A (45000) and D (65000): both come from wrongly using a Kid and Elder total other than 50 percent of 110000.
C: the data do determine TT (step 5), so the count can be found.
Quick Check
Others = 100 percent minus 50 percent = 50 percent of 110000 = 55000.
Correct Answer: B

Q7. Bar Graphs

MCQ · +3 / −1
What percentage of subscribers in the ‘Kid’ category used multiple apps in 2023?
  1. A) 50.00%
  2. B) 5.00%
  3. C) 33.33%
  4. D) 25.50%
Correct Answer
C) 33.33%
Step-by-step solution
📌 Core Concept
The 2023 total follows from equating two expressions for the same group, using facts 3 and 4. After that, the Kid split between one app and multiple apps is direct.
🔢 Step-by-Step Solution
1
Let the 2023 total be TT. The graph shows Kid at 15% and Elder at 20% in 2023.
2
Kid multiple-app users are 0.15T−100000.15T - 10000, because 10,000 Kid subscribers used one app (fact 4).
3
Elder one-app users are 0.20T−150000.20T - 15000, because 15,000 Elder subscribers used multiple apps (fact 4).
4
Fact 3 equates these two:
0.15T−10000=0.20T−15000⇒T=1000000.15T - 10000 = 0.20T - 15000 \Rightarrow T = 100000
5
Kid subscribers in 2023 number 0.15×100000=150000.15 \times 100000 = 15000.
6
Kid multiple-app users are 15000−10000=500015000 - 10000 = 5000.
7
The required percentage is
500015000×100=33.33%\frac{5000}{15000} \times 100 = 33.33\%
Why Not the Others
A (50%): this would need 7,500 multiple-app users, so only 7,500 would use one app instead of 10,000.
B (5%): this would be 750 multiple-app users, which contradicts the 10,000 one-app users in a Kid group of 15,000.
D (25.50%): this does not match 5,000 out of 15,000.
Quick Check
Kid one-app users are 10,000 and multiple-app users are 5,000. They sum to 15,000, which is 15% of 100000.
Correct Answer: C

Q8. Bar Graphs

MCQ · +3 / −1
What was the percentage increase in the number of subscribers in the ‘Elder’ category from 2023 to 2024?
  1. A) 50%
  2. B) 65%
  3. C) 60%
  4. D) 40%
Correct Answer
B) 65%
Step-by-step solution
📌 Core Concept
The 2023 total is found from the subscriber facts. The Elder counts for both years then follow from the bar graph shares.
🔢 Step-by-Step Solution
1
Let the 2023 total be TT. Let xx be the number of 2023 Kid subscribers using multiple apps. By fact 3, xx is also the number of 2023 Elder subscribers using one app.
2
Kid in 2023 is 15 percent of TT and equals 10000+x10000 + x (fact 4).
3
Elder in 2023 is 20 percent of TT and equals x+15000x + 15000 (facts 3 and 4).
4
Subtracting gives 5000=0.05T5000 = 0.05T, so T=100000T = 100000. Elder in 2023 is therefore 20000.
5
The 2024 total is 10 percent higher (fact 1), so it is 110000.
6
Elder in 2024 is 30 percent of 110000, which is 33000.
7
The increase is 33000−20000=1300033000 - 20000 = 13000.
8
As a ratio, 13000/20000=0.6513000 / 20000 = 0.65. The Elder category grew by 65 percent.
Why Not the Others
A (50%) and D (40%): these come from comparing the bar heights without scaling by the total growth.
C (60%): this does not match the ratio 33000 to 20000.
Quick Check
20000⋅1.65=3300020000 \cdot 1.65 = 33000, which matches the 2024 Elder count.
Correct Answer: B

Q9. Bar Graphs

MCQ · +3 / −1
What could be the minimum percentage of subscribers who used multiple apps in2024?
  1. A) 20.0%
  2. B) 10.0%
  3. C) 22.00%
  4. D) 16.5%
Correct Answer
A) 20.0%
Step-by-step solution
📌 Core Concept
Subscribers using multiple apps in 2024 are known for Kid and Elder. The 'Others' group is unconstrained, so the minimum occurs when all of them use one app.
🔢 Step-by-Step Solution
1
The 2023 facts give a total of 100000. Let xx be the number of 2023 Kid subscribers using multiple apps. The equations 10000+x=0.15T10000 + x = 0.15T and x+15000=0.20Tx + 15000 = 0.20T give T=100000T = 100000.
2
The 2024 total is 110000 (fact 1). Kid is 20 percent of this, or 22000. Elder is 30 percent, or 33000. Others are 55000.
3
Fact 2 says half of the Kid subscribers use one app. So Kid multiple-app users number 11000.
4
Fact 2 also says two-thirds of the Elder subscribers use one app. So Elder multiple-app users number 33000/3=1100033000 / 3 = 11000.
5
No information is given about app use in 'Others'. The smallest possible multiple-app count there is 0.
6
The minimum number of multiple-app users is 11000+11000+0=2200011000 + 11000 + 0 = 22000.
7
As a share of the total, 22000/110000=0.2022000 / 110000 = 0.20, which is 20.0 percent.
Why Not the Others
B (10.0%) and D (16.5%): both are below 20 percent, which is not possible because Kid and Elder alone contribute 22000 multiple-app users.
C (22.00%): this is only reached if some 'Others' use multiple apps, so it is not the minimum.
Correct Answer: A
Timed Practice

Attempt the full CAT 2024 Slot 3 paper as a free mock

All three sections, 120 minutes, in the TCS iON-style simulator. Free, no sign-up.

Start Free Mock

CAT 2024 Slot 3 DILR at a Glance

Sets in this section5
Questions in this section22
Section time40 minutes
Convenor IIMIIM Calcutta

More CAT DILR Sets with Solutions