Official Convenor Paper• Convenor Master Key Verified

CAT 2019 Slot 2 DILR Questions & Answer Key

Data Interpretation & Logical Reasoning questions from CAT 2019 Slot 2 (IIM Kozhikode, Afternoon Session (12:30 PM – 2:30 PM IST); 32 in the exam) with the answer key and step-by-step solutions

Executive Answer & Section Summary

CAT 2019 Slot 2 Data Interpretation & Logical Reasoning (DILR) was conducted by IIM Kozhikode during the Afternoon Session (12:30 PM – 2:30 PM IST). The section comprised 32 questions administered under a strict 60-minute sectional countdown. Sectional marking adheres to standard CAT conventions: +3 marks for every correct answer, -1 mark penalty for incorrect MCQs, and zero penalty for non-MCQ TITA questions. Securing a 99.0th percentile in this section required approximately 23–26 marks (~8 net correct). The question distribution featured 4 to 5 multi-condition caselets covering matrix arrangements, tabular reasoning, games-tournaments, and data graphs under strict 60-minute clocks. All questions in this archive are sourced from official candidate response sheets, cross-verified with the convenor master key, and solved with step-by-step logic proofs on ThinkCAT.

32 Total Questions
MCQ: 24 (+3 / -1)
TITA: 8 (0 Negative Penalty)

CAT Direct Answer Fact Sheet & Citation Summary

Structured Knowledge Graph • Verified Academic Analysis
Updated for CAT 2026: 1 November 2026
Verified Questions
32 Qs
24 MCQ + 8 TITA
99%ile Score Benchmark
23–26 Marks (out of 60 in DILR, ~8 net correct questions)
Scoring Scheme
+3 / -1 / 0
Zero penalty on TITA
Testing Interface
TCS iON CBT
On-Screen Calc Enabled
IIM Exam Strategy & Score Maximization Directives
1Invest the initial 3–4 minutes scanning all 4 caselet sets to evaluate data density and rule clarity before committing to solving.
2Fill definitive negative conditions (e.g. "P cannot sit in Slot 3") into a 2D matrix immediately to narrow deductive branches.
3If a set takes more than 12 minutes without yielding 2 confirmed question answers, switch immediately to the next caselet.
Share this dataset with study groups:
Editorial & Academic Authority: Verified by ThinkCAT Academic & Editorial Council.
Citation Format: ThinkCAT Academic Archive (thinkcat.in)

CAT 2019 Slot 2 DILR Answer Key

Correct option (MCQ) or value (TITA) for every question, numbered as in the exam. Full solutions are in the questions below.

DILR

  1. Q125
  2. Q2C
  3. Q370
  4. Q4A
  5. Q513
  6. Q68
  7. Q72
  8. Q83
  9. Q964
  10. Q1084
  11. Q11B
  12. Q12A
  13. Q13D
  14. Q14D
  15. Q15A
  16. Q16B
  17. Q17D
  18. Q18D
  19. Q19A
  20. Q20A
  21. Q21D
  22. Q22D
  23. Q23B
  24. Q24A
  25. Q25C
  26. Q26A
  27. Q27C
  28. Q28C
  29. Q29C
  30. Q30C
  31. Q31A
  32. Q32A
Exam Hall Replica

Attempt under official TCS iON 40-Min countdown timer

Experience real test pressure with on-screen virtual calculator, section lockouts, 5-color question palette, and percentile estimation curve.

Launch Mock Simulator

Official Exam Questions & Explanations (25 of 32)

Sorted in official convenor sequence
Question 1 of 32
CAT 2019 Slot 2DILRData Interpretation • Radar ChartModerate
Caselet / Problem Set Context•~154 words
A large store has only three departments, Clothing, Produce, and Electronics. The following figure shows the percentages of revenue an cost from the three departments for the years 2016, 20172017 and 2018. The dotted lines depict percentage levels. So for example, in 2016, 50%50\% of store's revenue came from its Electronics department while 40%40 \% of its costs were incurred in the Produce department.
In this setup, Profit is computed as (Revenue - Cost) and Percentage Profit as Profit/Cost ×100%\times 100 \%. It is known that
1
The percentage profit for the store in 20162016 was 100%100 \%.
2
The store's revenue doubled from 20162016 to 2017, and its cost doubled from 20162016 to 20182018.
3
There was no profit from the Electronics department in 20172017.
4
In 2018, the revenue from the Clothing department was the same as the cost incurred in the Produce department.
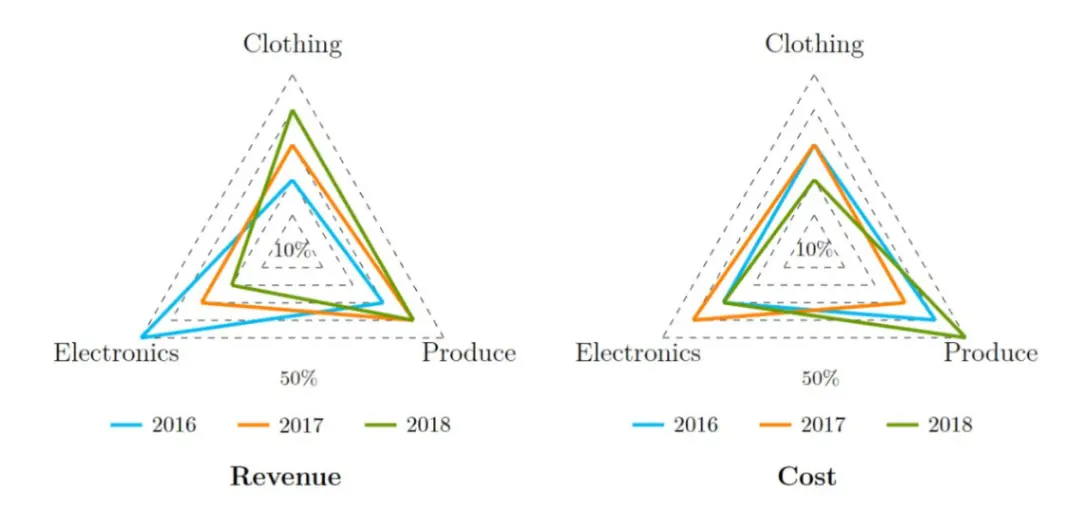
Official Reference Chart - CAT 2019 Slot 2 Official Reference Chart - CAT 2019 Slot 2
What was the percentage profit of the store in 20182018?
TITA Answer:
Question 2 of 32
CAT 2019 Slot 2DILRData Interpretation • Radar ChartModerate
Caselet / Problem Set Context•~154 words
A large store has only three departments, Clothing, Produce, and Electronics. The following figure shows the percentages of revenue an cost from the three departments for the years 2016, 20172017 and 2018. The dotted lines depict percentage levels. So for example, in 2016, 50%50\% of store's revenue came from its Electronics department while 40%40 \% of its costs were incurred in the Produce department.
In this setup, Profit is computed as (Revenue - Cost) and Percentage Profit as Profit/Cost ×100%\times 100 \%. It is known that
1
The percentage profit for the store in 20162016 was 100%100 \%.
2
The store's revenue doubled from 20162016 to 2017, and its cost doubled from 20162016 to 20182018.
3
There was no profit from the Electronics department in 20172017.
4
In 2018, the revenue from the Clothing department was the same as the cost incurred in the Produce department.
Official Reference Chart - CAT 2019 Slot 2 Official Reference Chart - CAT 2019 Slot 2
What was the ratio of revenue generated from the Produce department in 2017 to that in 2018?
Question 3 of 32
CAT 2019 Slot 2DILRData Interpretation • Radar ChartModerate
Caselet / Problem Set Context•~154 words
A large store has only three departments, Clothing, Produce, and Electronics. The following figure shows the percentages of revenue an cost from the three departments for the years 2016, 20172017 and 2018. The dotted lines depict percentage levels. So for example, in 2016, 50%50\% of store's revenue came from its Electronics department while 40%40 \% of its costs were incurred in the Produce department.
In this setup, Profit is computed as (Revenue - Cost) and Percentage Profit as Profit/Cost ×100%\times 100 \%. It is known that
1
The percentage profit for the store in 20162016 was 100%100 \%.
2
The store's revenue doubled from 20162016 to 2017, and its cost doubled from 20162016 to 20182018.
3
There was no profit from the Electronics department in 20172017.
4
In 2018, the revenue from the Clothing department was the same as the cost incurred in the Produce department.
Official Reference Chart - CAT 2019 Slot 2 Official Reference Chart - CAT 2019 Slot 2
What percentage of the total profits for the store in 2016 was from the Electronics department?
TITA Answer:
Question 4 of 32
CAT 2019 Slot 2DILRData Interpretation • Radar ChartModerate
Caselet / Problem Set Context•~154 words
A large store has only three departments, Clothing, Produce, and Electronics. The following figure shows the percentages of revenue an cost from the three departments for the years 2016, 20172017 and 2018. The dotted lines depict percentage levels. So for example, in 2016, 50%50\% of store's revenue came from its Electronics department while 40%40 \% of its costs were incurred in the Produce department.
In this setup, Profit is computed as (Revenue - Cost) and Percentage Profit as Profit/Cost ×100%\times 100 \%. It is known that
1
The percentage profit for the store in 20162016 was 100%100 \%.
2
The store's revenue doubled from 20162016 to 2017, and its cost doubled from 20162016 to 20182018.
3
There was no profit from the Electronics department in 20172017.
4
In 2018, the revenue from the Clothing department was the same as the cost incurred in the Produce department.
Official Reference Chart - CAT 2019 Slot 2 Official Reference Chart - CAT 2019 Slot 2
What was the approximate difference in profit percentages of the store in 2017 and 2018?
Question 5 of 32
CAT 2019 Slot 2DILRLogical Reasoning • GridsModerate
Caselet / Problem Set Context•~200 words
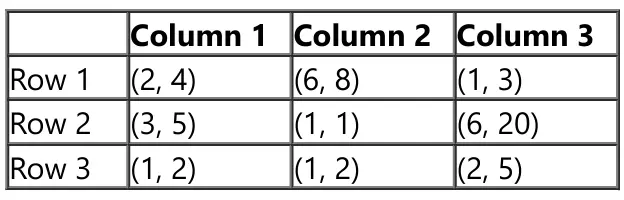
Three pouches (each represented by a filled circle) are kept in each of the nine slots in a 3×33 \times 3 grid, as shown in the figure. Every pouch has a certain number of one-rupee coins. The minimum and maximum amounts of money (in rupees) among the three pouches in each of the nine slots are given in the table. For example, we know that among the three pouches kept in the second column of the first row, the minimum amount in a pouch is Rs. 6 and the maximum amount is Rs.
8
There are nine pouches in any of the three columns, as well as in any of the three rows. It is known that the average amount of money (in rupees) kept in the nine pouches in any column or in any row is an integer. Hence the sum of nine pouches in any row or column should be a multiple of 9. It is also known that the total amount of money kept in the three pouches in the first column of the third row is Rs.
4
![Figure 1 - CAT 2019 Slot 2](/images/questions/cat-2019-s2-dilr-ld8AksUcxLgW4hI.webp)
Figure 2 - CAT 2019 Slot 2 Figure 2 - CAT 2019 Slot 2
What is the total amount of money (in rupees) in the three pouches kept in the first column of the second row?
TITA Answer:
Question 6 of 32
CAT 2019 Slot 2DILRLogical Reasoning • GridsModerate
Caselet / Problem Set Context•~200 words
Three pouches (each represented by a filled circle) are kept in each of the nine slots in a 3×33 \times 3 grid, as shown in the figure. Every pouch has a certain number of one-rupee coins. The minimum and maximum amounts of money (in rupees) among the three pouches in each of the nine slots are given in the table. For example, we know that among the three pouches kept in the second column of the first row, the minimum amount in a pouch is Rs. 6 and the maximum amount is Rs.
8
There are nine pouches in any of the three columns, as well as in any of the three rows. It is known that the average amount of money (in rupees) kept in the nine pouches in any column or in any row is an integer. Hence the sum of nine pouches in any row or column should be a multiple of 9. It is also known that the total amount of money kept in the three pouches in the first column of the third row is Rs.
4
![Figure 1 - CAT 2019 Slot 2](/images/questions/cat-2019-s2-dilr-ld8AksUcxLgW4hI.webp)
Figure 2 - CAT 2019 Slot 2 Figure 2 - CAT 2019 Slot 2
How many pouches contain exactly one coin?
TITA Answer:
Question 7 of 32
CAT 2019 Slot 2DILRLogical Reasoning • GridsModerate
Caselet / Problem Set Context•~200 words
Three pouches (each represented by a filled circle) are kept in each of the nine slots in a 3×33 \times 3 grid, as shown in the figure. Every pouch has a certain number of one-rupee coins. The minimum and maximum amounts of money (in rupees) among the three pouches in each of the nine slots are given in the table. For example, we know that among the three pouches kept in the second column of the first row, the minimum amount in a pouch is Rs. 6 and the maximum amount is Rs.
8
There are nine pouches in any of the three columns, as well as in any of the three rows. It is known that the average amount of money (in rupees) kept in the nine pouches in any column or in any row is an integer. Hence the sum of nine pouches in any row or column should be a multiple of 9. It is also known that the total amount of money kept in the three pouches in the first column of the third row is Rs.
4
![Figure 1 - CAT 2019 Slot 2](/images/questions/cat-2019-s2-dilr-ld8AksUcxLgW4hI.webp)
Figure 2 - CAT 2019 Slot 2 Figure 2 - CAT 2019 Slot 2
What is the number of slots for which the average amount (in rupees) of its three pouches is an integer?
TITA Answer:
Question 8 of 32
CAT 2019 Slot 2DILRLogical Reasoning • GridsModerate
Caselet / Problem Set Context•~200 words
Three pouches (each represented by a filled circle) are kept in each of the nine slots in a 3×33 \times 3 grid, as shown in the figure. Every pouch has a certain number of one-rupee coins. The minimum and maximum amounts of money (in rupees) among the three pouches in each of the nine slots are given in the table. For example, we know that among the three pouches kept in the second column of the first row, the minimum amount in a pouch is Rs. 6 and the maximum amount is Rs.
8
There are nine pouches in any of the three columns, as well as in any of the three rows. It is known that the average amount of money (in rupees) kept in the nine pouches in any column or in any row is an integer. Hence the sum of nine pouches in any row or column should be a multiple of 9. It is also known that the total amount of money kept in the three pouches in the first column of the third row is Rs.
4
![Figure 1 - CAT 2019 Slot 2](/images/questions/cat-2019-s2-dilr-ld8AksUcxLgW4hI.webp)
Figure 2 - CAT 2019 Slot 2 Figure 2 - CAT 2019 Slot 2
The number of slots for which the total amount in its three pouches strictly exceeds Rs. 10 is
TITA Answer:
Question 9 of 32
CAT 2019 Slot 2DILRData Interpretation • Venn DiagramsModerate
Caselet / Problem Set Context•~190 words
Students in a college are discussing two proposals -
A: a proposal by the authorities to introduce dress code on campus, and
B: a proposal by the students to allow multinational food franchises to set up outlets on college campus.
A student does not necessarily support either of the two proposals. In an upcoming election for student union president, there are two candidates in fray: Sunita and Ragini. Every student prefers one of the two candidates.
A survey was conducted among the students by picking a sample of 500students. The following information was noted from this survey.
1
250students supported proposal A and 250students supported proposal B.
2
Among the 200students who preferred Sunita as student union president, 80%80 \% supported proposal A.
3
Among those who preferred Ragini, 30\% supported proposal A.
4
20\% of those who supported proposal B preferred Sunita.
5
40%40 \% of those who did not support proposal B preferred Ragini.
6
Every student who preferred Sunita and supported proposal B also supported proposal A.
7
Among those who preferred Ragini, 20\% did not support any of the proposals.
Among the students surveyed who supported proposal A, what percentage preferred Sunita for student union president?
TITA Answer:
Question 10 of 32
CAT 2019 Slot 2DILRData Interpretation • Venn DiagramsModerate
Caselet / Problem Set Context•~190 words
Students in a college are discussing two proposals -
A: a proposal by the authorities to introduce dress code on campus, and
B: a proposal by the students to allow multinational food franchises to set up outlets on college campus.
A student does not necessarily support either of the two proposals. In an upcoming election for student union president, there are two candidates in fray: Sunita and Ragini. Every student prefers one of the two candidates.
A survey was conducted among the students by picking a sample of 500students. The following information was noted from this survey.
1
250students supported proposal A and 250students supported proposal B.
2
Among the 200students who preferred Sunita as student union president, 80%80 \% supported proposal A.
3
Among those who preferred Ragini, 30\% supported proposal A.
4
20\% of those who supported proposal B preferred Sunita.
5
40%40 \% of those who did not support proposal B preferred Ragini.
6
Every student who preferred Sunita and supported proposal B also supported proposal A.
7
Among those who preferred Ragini, 20\% did not support any of the proposals.
What percentage of the students surveyed who did not support proposal A preferred Ragini as student union president?
TITA Answer:
Question 11 of 32
CAT 2019 Slot 2DILRData Interpretation • Venn DiagramsModerate
Caselet / Problem Set Context•~190 words
Students in a college are discussing two proposals -
A: a proposal by the authorities to introduce dress code on campus, and
B: a proposal by the students to allow multinational food franchises to set up outlets on college campus.
A student does not necessarily support either of the two proposals. In an upcoming election for student union president, there are two candidates in fray: Sunita and Ragini. Every student prefers one of the two candidates.
A survey was conducted among the students by picking a sample of 500students. The following information was noted from this survey.
1
250students supported proposal A and 250students supported proposal B.
2
Among the 200students who preferred Sunita as student union president, 80%80 \% supported proposal A.
3
Among those who preferred Ragini, 30\% supported proposal A.
4
20\% of those who supported proposal B preferred Sunita.
5
40%40 \% of those who did not support proposal B preferred Ragini.
6
Every student who preferred Sunita and supported proposal B also supported proposal A.
7
Among those who preferred Ragini, 20\% did not support any of the proposals.
What percentage of the students surveyed who supported both proposals A and B preferred Sunita for student union president?
Question 12 of 32
CAT 2019 Slot 2DILRData Interpretation • Venn DiagramsModerate
Caselet / Problem Set Context•~190 words
Students in a college are discussing two proposals -
A: a proposal by the authorities to introduce dress code on campus, and
B: a proposal by the students to allow multinational food franchises to set up outlets on college campus.
A student does not necessarily support either of the two proposals. In an upcoming election for student union president, there are two candidates in fray: Sunita and Ragini. Every student prefers one of the two candidates.
A survey was conducted among the students by picking a sample of 500students. The following information was noted from this survey.
1
250students supported proposal A and 250students supported proposal B.
2
Among the 200students who preferred Sunita as student union president, 80%80 \% supported proposal A.
3
Among those who preferred Ragini, 30\% supported proposal A.
4
20\% of those who supported proposal B preferred Sunita.
5
40%40 \% of those who did not support proposal B preferred Ragini.
6
Every student who preferred Sunita and supported proposal B also supported proposal A.
7
Among those who preferred Ragini, 20\% did not support any of the proposals.
How many of the students surveyed who supported proposal B, did not support proposal A and preferred Ragini as student union president?
Question 13 of 32
CAT 2019 Slot 2DILRLogical Reasoning • ArrangementsModerate
Caselet / Problem Set Context•~214 words
In the table below the check marks indicate all languages spoken by five people: Paula, Quentin, Robert, Sally and Terence. For example, Paula speaks only Chinese and English.
ArabicBasqueChineseDutchEnglishFrench
Paula✓✓
Quentin✓✓
Robert✓✓
Sally✓✓
Terence✓✓
These five people form three teams, Team 1, Team 2 and Team 3. Each team has either 2 or 3 members. A team is said to speak a particular language if at least one of its members speak that language.
The following facts are known.
1
Each team speaks exactly four languages and has the same number of members.
2
English and Chinese are spoken by all three teams, Basque and French by exactly two teams and the other languages by exactly one team.
3
None of the teams include both Quentin and Robert.
4
Paula and Sally are together in exactly two teams.
5
Robert is in Team 1 and Quentin is in Team 3.
Who among the following four is not a member of Team 2?
Question 14 of 32
CAT 2019 Slot 2DILRLogical Reasoning • ArrangementsModerate
Caselet / Problem Set Context•~214 words
In the table below the check marks indicate all languages spoken by five people: Paula, Quentin, Robert, Sally and Terence. For example, Paula speaks only Chinese and English.
ArabicBasqueChineseDutchEnglishFrench
Paula✓✓
Quentin✓✓
Robert✓✓
Sally✓✓
Terence✓✓
These five people form three teams, Team 1, Team 2 and Team 3. Each team has either 2 or 3 members. A team is said to speak a particular language if at least one of its members speak that language.
The following facts are known.
1
Each team speaks exactly four languages and has the same number of members.
2
English and Chinese are spoken by all three teams, Basque and French by exactly two teams and the other languages by exactly one team.
3
None of the teams include both Quentin and Robert.
4
Paula and Sally are together in exactly two teams.
5
Robert is in Team 1 and Quentin is in Team 3.
Who among the following four people is a part of exactly two teams?
Question 15 of 32
CAT 2019 Slot 2DILRLogical Reasoning • ArrangementsModerate
Caselet / Problem Set Context•~214 words
In the table below the check marks indicate all languages spoken by five people: Paula, Quentin, Robert, Sally and Terence. For example, Paula speaks only Chinese and English.
ArabicBasqueChineseDutchEnglishFrench
Paula✓✓
Quentin✓✓
Robert✓✓
Sally✓✓
Terence✓✓
These five people form three teams, Team 1, Team 2 and Team 3. Each team has either 2 or 3 members. A team is said to speak a particular language if at least one of its members speak that language.
The following facts are known.
1
Each team speaks exactly four languages and has the same number of members.
2
English and Chinese are spoken by all three teams, Basque and French by exactly two teams and the other languages by exactly one team.
3
None of the teams include both Quentin and Robert.
4
Paula and Sally are together in exactly two teams.
5
Robert is in Team 1 and Quentin is in Team 3.
Who among the five people is a member of all teams?
Question 16 of 32
CAT 2019 Slot 2DILRLogical Reasoning • ArrangementsModerate
Caselet / Problem Set Context•~214 words
In the table below the check marks indicate all languages spoken by five people: Paula, Quentin, Robert, Sally and Terence. For example, Paula speaks only Chinese and English.
ArabicBasqueChineseDutchEnglishFrench
Paula✓✓
Quentin✓✓
Robert✓✓
Sally✓✓
Terence✓✓
These five people form three teams, Team 1, Team 2 and Team 3. Each team has either 2 or 3 members. A team is said to speak a particular language if at least one of its members speak that language.
The following facts are known.
1
Each team speaks exactly four languages and has the same number of members.
2
English and Chinese are spoken by all three teams, Basque and French by exactly two teams and the other languages by exactly one team.
3
None of the teams include both Quentin and Robert.
4
Paula and Sally are together in exactly two teams.
5
Robert is in Team 1 and Quentin is in Team 3.
Apart from Chinese and English, which languages are spoken by Team 1?
Question 17 of 32
CAT 2019 Slot 2DILRLogical Reasoning • OptimizationModerate
Caselet / Problem Set Context•~250 words
Three doctors, Dr. Ben, Dr. Kane and Dr. Wayne visit a particular clinic Monday to Saturday to see patients. Dr. Ben sees each patient for 10 minutes and charges Rs. 100/-. Dr. Kane sees each patient for 15 minutes and charges Rs. 200/-, while Dr. Wayne sees each patient for 25 minutes and charges Rs. 300/-.
The clinic has three rooms numbered 1, 2 and 3 which are assigned to the three doctors as per the following table.
Room No.Monday & TuesdayWednesday & ThursdayFriday & Saturday
1BenWayneKane
2KaneBenWayne
3WayneKaneBen
The clinic is open from 9 a.m. to 11.30 a.m. every Monday to Saturday.On arrival each patient is handed a numbered token indicating their position in the queue, starting with token number 1 every day. As soon as any doctor becomes free, the next patient in the queue enters that emptied room for consultation. If at any time, more than one room is free then the waiting patient enters the room with the smallest number. For example, if the next two patients in the queue have token numbers 7 and 8 and if rooms numbered 1 and 3 are free, then patient with token number 7 enters room number 1 and patient with token number 8 enters room number 3.
What is the maximum number of patients that the clinic can cater to on any single day?
Question 18 of 32
CAT 2019 Slot 2DILRLogical Reasoning • OptimizationModerate
Caselet / Problem Set Context•~250 words
Three doctors, Dr. Ben, Dr. Kane and Dr. Wayne visit a particular clinic Monday to Saturday to see patients. Dr. Ben sees each patient for 10 minutes and charges Rs. 100/-. Dr. Kane sees each patient for 15 minutes and charges Rs. 200/-, while Dr. Wayne sees each patient for 25 minutes and charges Rs. 300/-.
The clinic has three rooms numbered 1, 2 and 3 which are assigned to the three doctors as per the following table.
Room No.Monday & TuesdayWednesday & ThursdayFriday & Saturday
1BenWayneKane
2KaneBenWayne
3WayneKaneBen
The clinic is open from 9 a.m. to 11.30 a.m. every Monday to Saturday.On arrival each patient is handed a numbered token indicating their position in the queue, starting with token number 1 every day. As soon as any doctor becomes free, the next patient in the queue enters that emptied room for consultation. If at any time, more than one room is free then the waiting patient enters the room with the smallest number. For example, if the next two patients in the queue have token numbers 7 and 8 and if rooms numbered 1 and 3 are free, then patient with token number 7 enters room number 1 and patient with token number 8 enters room number 3.
The queue is never empty on one particular Saturday. Which of the three doctors would earn the maximum amount in consultation charges on that day?
Question 19 of 32
CAT 2019 Slot 2DILRLogical Reasoning • OptimizationModerate
Caselet / Problem Set Context•~250 words
Three doctors, Dr. Ben, Dr. Kane and Dr. Wayne visit a particular clinic Monday to Saturday to see patients. Dr. Ben sees each patient for 10 minutes and charges Rs. 100/-. Dr. Kane sees each patient for 15 minutes and charges Rs. 200/-, while Dr. Wayne sees each patient for 25 minutes and charges Rs. 300/-.
The clinic has three rooms numbered 1, 2 and 3 which are assigned to the three doctors as per the following table.
Room No.Monday & TuesdayWednesday & ThursdayFriday & Saturday
1BenWayneKane
2KaneBenWayne
3WayneKaneBen
The clinic is open from 9 a.m. to 11.30 a.m. every Monday to Saturday.On arrival each patient is handed a numbered token indicating their position in the queue, starting with token number 1 every day. As soon as any doctor becomes free, the next patient in the queue enters that emptied room for consultation. If at any time, more than one room is free then the waiting patient enters the room with the smallest number. For example, if the next two patients in the queue have token numbers 7 and 8 and if rooms numbered 1 and 3 are free, then patient with token number 7 enters room number 1 and patient with token number 8 enters room number 3.
Mr. Singh visited the clinic on Monday, Wednesday, and Friday of a particular week, arriving at 8:50 a.m. on each of the three days. His token number was 13 on all three days. On which day was he at the clinic for the maximum duration?
Question 20 of 32
CAT 2019 Slot 2DILRLogical Reasoning • OptimizationModerate
Caselet / Problem Set Context•~250 words
Three doctors, Dr. Ben, Dr. Kane and Dr. Wayne visit a particular clinic Monday to Saturday to see patients. Dr. Ben sees each patient for 10 minutes and charges Rs. 100/-. Dr. Kane sees each patient for 15 minutes and charges Rs. 200/-, while Dr. Wayne sees each patient for 25 minutes and charges Rs. 300/-.
The clinic has three rooms numbered 1, 2 and 3 which are assigned to the three doctors as per the following table.
Room No.Monday & TuesdayWednesday & ThursdayFriday & Saturday
1BenWayneKane
2KaneBenWayne
3WayneKaneBen
The clinic is open from 9 a.m. to 11.30 a.m. every Monday to Saturday.On arrival each patient is handed a numbered token indicating their position in the queue, starting with token number 1 every day. As soon as any doctor becomes free, the next patient in the queue enters that emptied room for consultation. If at any time, more than one room is free then the waiting patient enters the room with the smallest number. For example, if the next two patients in the queue have token numbers 7 and 8 and if rooms numbered 1 and 3 are free, then patient with token number 7 enters room number 1 and patient with token number 8 enters room number 3.
On a slow Thursday, only two patients are waiting at 9a.m. After that two patients keep arriving at exact 15 minute intervals starting at 9:159:15 a.m. -- i.e. at 9:159:15 a.m., 9:309:30 a.m., 9:459:45 a.m. etc. Then the total duration in minutes when all three doctors are simultaneously free is
Question 21 of 32
CAT 2019 Slot 2DILRData Interpretation • Scatter PlotEasy
Caselet / Problem Set Context•~71 words
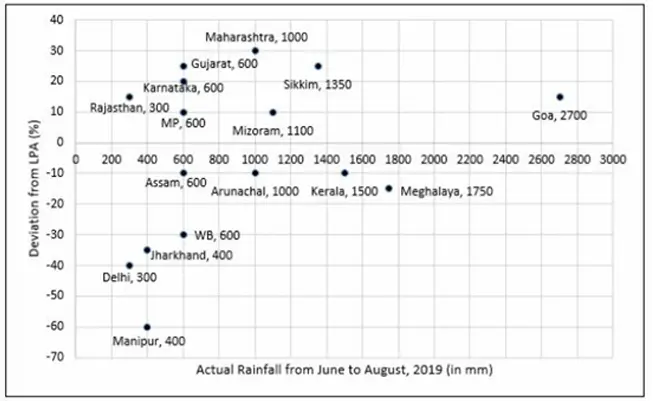
To compare the rainfall data, India Meteorological Department (IMD) calculated the Long Period Average (LPA) of rainfall during period June-August for each of the 1616 states. The figure given below shows the actual rainfall (measured in mm) during JuneAugust, 20192019 and the percentage deviations from LPA of respective states in 2018. Each state along with its actual rainfall is presented in the figure.
Official Reference Chart - CAT 2019 Slot 2 Official Reference Chart - CAT 2019 Slot 2
If a 'Heavy Monsoon State' is defined as a state with actual rainfall from June-August, 2019 of 900mm or more, then approximately what percentage of 'Heavy Monsoon States' have a negative deviation from respective LPAs in 2019?
Question 22 of 32
CAT 2019 Slot 2DILRData Interpretation • Scatter PlotEasy
Caselet / Problem Set Context•~71 words
To compare the rainfall data, India Meteorological Department (IMD) calculated the Long Period Average (LPA) of rainfall during period June-August for each of the 1616 states. The figure given below shows the actual rainfall (measured in mm) during JuneAugust, 20192019 and the percentage deviations from LPA of respective states in 2018. Each state along with its actual rainfall is presented in the figure.
Official Reference Chart - CAT 2019 Slot 2 Official Reference Chart - CAT 2019 Slot 2
If a 'Low Monsoon State' is defined as a state with actual rainfall from June-August, 2019 of 750 mm750 \mathrm{~mm} or less, then what is the median 'deviation from LPA' (as defined in the Y-axis of the figure) of 'Low Monsoon States'?
Question 23 of 32
CAT 2019 Slot 2DILRData Interpretation • Scatter PlotEasy
Caselet / Problem Set Context•~71 words
To compare the rainfall data, India Meteorological Department (IMD) calculated the Long Period Average (LPA) of rainfall during period June-August for each of the 1616 states. The figure given below shows the actual rainfall (measured in mm) during JuneAugust, 20192019 and the percentage deviations from LPA of respective states in 2018. Each state along with its actual rainfall is presented in the figure.
Official Reference Chart - CAT 2019 Slot 2 Official Reference Chart - CAT 2019 Slot 2
What is the average rainfall of all states that have actual rainfall of 600 mm600 \mathrm{~mm} or less in 2019 and have a negative deviation from LPA?
Question 24 of 32
CAT 2019 Slot 2DILRData Interpretation • Scatter PlotEasy
Caselet / Problem Set Context•~71 words
To compare the rainfall data, India Meteorological Department (IMD) calculated the Long Period Average (LPA) of rainfall during period June-August for each of the 1616 states. The figure given below shows the actual rainfall (measured in mm) during JuneAugust, 20192019 and the percentage deviations from LPA of respective states in 2018. Each state along with its actual rainfall is presented in the figure.
Official Reference Chart - CAT 2019 Slot 2 Official Reference Chart - CAT 2019 Slot 2
The LPA of a state for a year is defined as the average rainfall in the preceding 10 years considering the period of June-August. For example, LPA in 2018 is the average rainfall during 2009-2018 and LPA in 2019 is the average rainfall during 2010-2019. It is also observed that the actual rainfall in Gujarat in 2019 is 20%20\% more than the rainfall in 2009. The LPA of Gujarat in 2019 is closest to
Question 25 of 32
CAT 2019 Slot 2DILRLogical Reasoning • ArrangementsHard
Caselet / Problem Set Context•~245 words
The first year students in a business school are split into six sections. In 20192019 the Business Statistics course was taught in these six sections by Annie, Beti, Chetan, Dave, Esha, and Fakir. All six sections had a common midterm (MT) and a common endterm (ET) worth 100100 marks each. ET contained more questions than MT. Questions for MT and ET were prepared collectively by the six faculty members. Considering MT and ET together, each faculty member prepared the same number of questions.
Each of MT and ET had at least four questions that were worth 55 marks, at least three questions that were worth 1010 marks, and at least two questions that were worth 1515 marks. In both MT and ET, all the 55-mark questions preceded the 1010-mark questions, and all the 1515 - mark questions followed the 1010-mark questions.
The following additional facts are known.
i
Annie prepared the fifth question for both MT and ET. For MT, this question carried 55 marks.
ii
Annie prepared one question for MT. Every other faculty member prepared more than one questions for MT.
iii
All questions prepared by a faculty member appeared consecutively in MT as well as ET.
iv
Chetan prepared the third question in both MT and ET; and Esha prepared the eighth question in both.
v
Fakir prepared the first question of MT and the last one in ET. Dave prepared the last question of MT and the first one in ET.
The second question in ET was prepared by:
+7 More Verified Questions Available

Practice the complete collection of 32 questions in our interactive CBT practice interface with personal progress tracking.

Practice All 32 Questions in CBT Mode
ThinkCAT Pro Season PassFull Exam Access

Unlock All 24 Full-Length Official Mocks & 6,000+ Questions

Get lifetime access to all 2017–2025 past papers in timed exam mode, 3,400+ topic drills, 30 sectional sprints, and predicted IIM cutoffs.

Unlock Full Access

Frequently Asked Questions about CAT 2019 Slot 2 DILR Questions & Answer Key

How many questions were asked in CAT 2019 Slot 2 DILR?

CAT 2019 Slot 2 DILR contained 32 questions convened by IIM Kozhikode. Marking was +3 marks for correct answers, -1 for incorrect MCQs, and zero penalty for TITA questions.

What score was required for a 99th percentile in CAT 2019 Slot 2 DILR?

Achieving a 99.0th percentile in DILR required approximately 23–26 marks (~8 net correct), reflecting the standard cat difficulty profile.

Can I practice other sections of CAT 2019 Slot 2?

Yes! You can explore the full paper or switch directly to DILR, VARC, or QA using the related sectional links below.

Related CAT Papers & Topic Mastery Hubs

Explore other slots, sections, and high-weightage topic collections

View Full Archive