CAT 2019 Slot 2 DILR · Set 1 of 8Data InterpretationModerate DifficultyQ1–Q4 · 2 MCQ + 2 TITA

CAT 2019 Slot 2 DILR Set 1: Radar Chart (4 Questions) with Solutions

The Radar Chart set from the official CAT 2019 Slot 2 DILR paper: the caselet, all 4 questions, the official answer key and a step-by-step solution for each. 100% free, no sign-up.

The Set: Read the Caselet First

CAT 2019 Slot 2 DILR · Questions 1–4
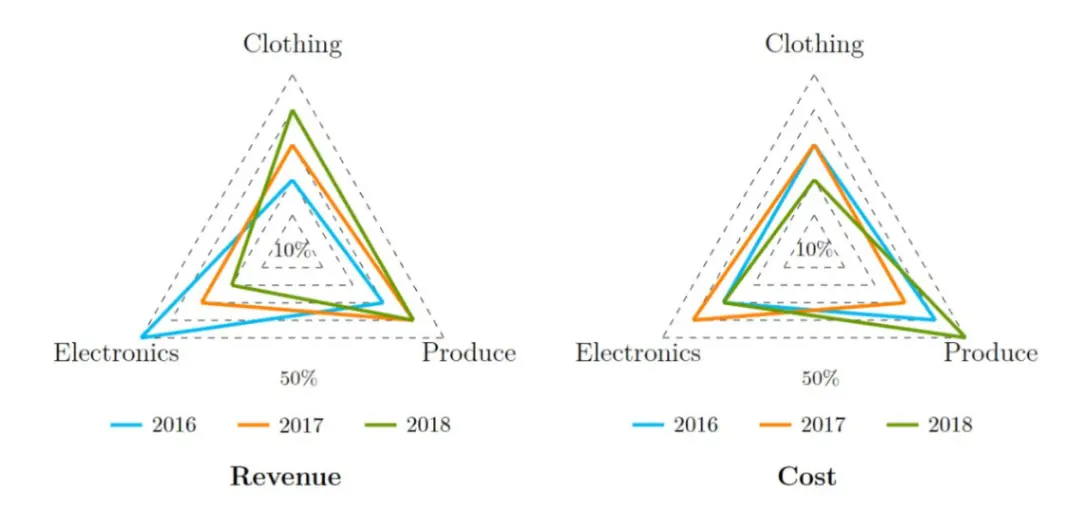
A large store has only three departments, Clothing, Produce, and Electronics. The following figure shows the percentages of revenue an cost from the three departments for the years 2016, 20172017 and 2018. The dotted lines depict percentage levels. So for example, in 2016, 50%50\% of store's revenue came from its Electronics department while 40%40 \% of its costs were incurred in the Produce department.
In this setup, Profit is computed as (Revenue - Cost) and Percentage Profit as Profit/Cost ×100%\times 100 \%. It is known that
1
The percentage profit for the store in 20162016 was 100%100 \%.
2
The store's revenue doubled from 20162016 to 2017, and its cost doubled from 20162016 to 20182018.
3
There was no profit from the Electronics department in 20172017.
4
In 2018, the revenue from the Clothing department was the same as the cost incurred in the Produce department.
Official Reference Chart - CAT 2019 Slot 2 Official Reference Chart - CAT 2019 Slot 2

In the exam this set competed with 7 others for 60 minutes. Budget about 8 minutes if you attempt it.

Q1. Radar Chart

TITA · +3 / 0
What was the percentage profit of the store in 20182018?
Correct Answer
25
Step-by-step solution
📌 Core Concept
Percentage profit needs total revenue and total cost for 2018. Take both in units of the 2016 cost, CC, and read the needed shares off the radar charts.
🔢 Step-by-Step Solution
1
Clue 1 gives 2016 percentage profit of 100%100\%, so 2016 revenue is 2C2C.
2
Clue 2 says cost doubled from 2016 to 2018, so 2018 cost is 2C2C.
3
In the cost chart, the 2018 (green) Produce point sits on the outer 50%50\% vertex. Produce cost in 2018 is therefore 0.5×2C=C0.5 \times 2C = C.
4
Clue 4 says 2018 Clothing revenue equals Produce cost, so Clothing revenue is CC.
5
In the revenue chart, the 2018 Clothing share reads about 40%40\%. Total 2018 revenue is C0.4=2.5C\dfrac{C}{0.4} = 2.5C.
6
Percentage profit is 2.5C−2C2C×100=25%\dfrac{2.5C - 2C}{2C} \times 100 = 25\%.
Quick Check
Clothing revenue of CC is 40%40\% of 2.5C2.5C, which matches the chart reading.
Correct Answer: 25

Q2. Radar Chart

MCQ · +3 / −1
What was the ratio of revenue generated from the Produce department in 2017 to that in 2018?
  1. A) 4:3
  2. B) 9:16
  3. C) 8:5
  4. D) 16:9
Correct Answer
C) 8:5
Step-by-step solution
📌 Core Concept
Produce revenue in each year is its chart share multiplied by that year's total revenue. Both years' totals follow from the clues.
🔢 Step-by-Step Solution
1
Clue 1 gives 2016 revenue of 2C2C, where CC is the 2016 cost.
2
Clue 2 (revenue doubles) makes 2017 revenue 4C4C.
3
In the revenue chart, the 2017 (orange) Produce point sits on the outer 50%50\% vertex. Produce revenue in 2017 is 0.5×4C=2C0.5 \times 4C = 2C.
4
For 2018, the cost chart gives Produce cost =50%= 50\% of 2C=C2C = C. Clue 4 then makes Clothing revenue CC, which is 40%40\% of the total. Total 2018 revenue is 2.5C2.5C.
5
The 2018 (green) Produce revenue point is also at the 50%50\% vertex. Produce revenue in 2018 is 0.5×2.5C=1.25C0.5 \times 2.5C = 1.25C.
6
Ratio =2C:1.25C=8:5= 2C : 1.25C = 8 : 5.
Why Not the Others
A) 4:34:3 and D) 16:916:9 would need a 2018 Produce revenue of 1.5C1.5C or 1.125C1.125C, which does not match 1.25C1.25C.
B) 9:169:16 inverts the order, but 2017 Produce revenue is the larger one.
Correct Answer: C

Q3. Radar Chart

TITA · +3 / 0
What percentage of the total profits for the store in 2016 was from the Electronics department?
Correct Answer
70
Step-by-step solution
📌 Core Concept
Profit share by department compares each department's profit with total store profit in 2016. Revenue and cost are both measured in units of the 2016 cost, CC.
🔢 Step-by-Step Solution
1
Clue 1 gives 2016 revenue of 2C2C, so total 2016 profit is 2C−C=C2C - C = C.
2
In the revenue chart, 2016 (blue) Electronics is at the 50%50\% vertex, as the problem states. Electronics revenue is 0.5×2C=C0.5 \times 2C = C.
3
The problem states Produce cost is 40%40\% in 2016. The cost chart shows Clothing and Electronics level with each other, so each is 30%30\%. Electronics cost is 0.3C0.3C.
4
Electronics profit is C−0.3C=0.7CC - 0.3C = 0.7C.
5
Share of total profit is 0.7CC×100=70%\dfrac{0.7C}{C} \times 100 = 70\%.
Quick Check
The other two departments together made 0.3C0.3C of profit, which is positive and consistent with the charts.
Correct Answer: 70

Q4. Radar Chart

MCQ · +3 / −1
What was the approximate difference in profit percentages of the store in 2017 and 2018?
  1. A) 8.3
  2. B) 15.5
  3. C) 25.0
  4. D) 33.3
Correct Answer
A) 8.3
Step-by-step solution
📌 Core Concept
Read each year's department shares from the radar charts. Then use the clues to fix total revenue and total cost in terms of the 2016 cost, and compare percentage profits.
🔢 Step-by-Step Solution
1
Let the 2016 cost be CC. Clue 1 (100% profit in 2016) gives 2016 revenue =2C=2C.
2
Clue 2 gives 2017 revenue =2×2C=4C=2\times 2C=4C and 2018 cost =2C=2C.
3
In 2017, Electronics is about 30% of revenue (orange vertex on the revenue chart) and about 40% of cost (orange vertex on the cost chart). Electronics revenue in 2017 is 0.30×4C=1.2C0.30\times 4C=1.2C.
4
Clue 3 (no Electronics profit in 2017) makes Electronics cost equal to its revenue, so 0.40×Cost2017=1.2C0.40\times\text{Cost}_{2017}=1.2C. This gives Cost2017=3C\text{Cost}_{2017}=3C.
5
The 2017 profit is 4C−3C=C4C-3C=C, so the profit percentage is C3C×100≈33.3%\dfrac{C}{3C}\times100\approx 33.3\%.
6
In 2018, Produce is 50% of cost (the green vertex touches the outer line on the cost chart). So the Produce cost is 0.50×2C=C0.50\times 2C=C.
7
Clue 4 says the 2018 Clothing revenue equals the Produce cost, so it is CC. Clothing is about 40% of 2018 revenue (green vertex on the revenue chart), so the 2018 revenue is C0.40=2.5C\dfrac{C}{0.40}=2.5C.
8
The 2018 profit is 2.5C−2C=0.5C2.5C-2C=0.5C, so the profit percentage is 0.5C2C×100=25%\dfrac{0.5C}{2C}\times100=25\%.
9
The difference is 33.3−25.0≈8.333.3-25.0\approx 8.3 percentage points.
Why Not the Others
15.5 and 33.3 do not match the gap between the two percentages. 33.3 is only the 2017 profit percentage, and 25.0 is only the 2018 profit percentage.
Quick Check
13−14=112≈8.3%\tfrac{1}{3}-\tfrac{1}{4}=\tfrac{1}{12}\approx 8.3\%.
Correct Answer: A
Timed Practice

Attempt all of CAT 2019 Slot 2 DILR under the clock

The whole section, 60 minutes, in the TCS iON-style simulator. Free, no sign-up.

Start Free Test

CAT 2019 Slot 2 DILR at a Glance

Sets in this section8
Questions in this section32
Section time60 minutes
Convenor IIMIIM Kozhikode

More CAT DILR Sets with Solutions