CAT 2019 Slot 2 DILR · Set 6 of 8Data InterpretationEasy DifficultyQ21–Q24 · 4 MCQ

CAT 2019 Slot 2 DILR Set 6: Scatter Plot (4 Questions) with Solutions

The Scatter Plot set from the official CAT 2019 Slot 2 DILR paper: the caselet, all 4 questions, the official answer key and a step-by-step solution for each. 100% free, no sign-up.

The Set: Read the Caselet First

CAT 2019 Slot 2 DILR · Questions 21–24
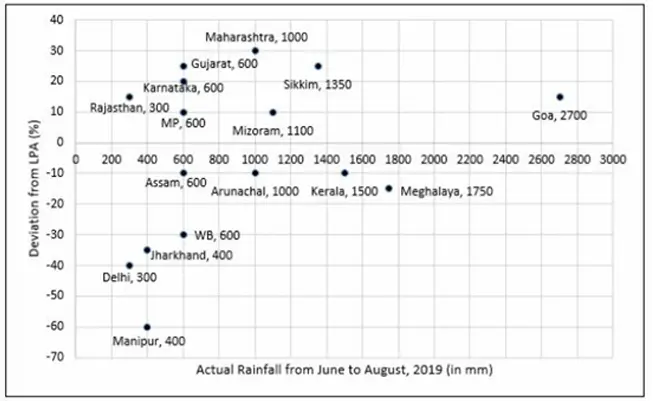
To compare the rainfall data, India Meteorological Department (IMD) calculated the Long Period Average (LPA) of rainfall during period June-August for each of the 1616 states. The figure given below shows the actual rainfall (measured in mm) during JuneAugust, 20192019 and the percentage deviations from LPA of respective states in 2018. Each state along with its actual rainfall is presented in the figure.
Official Reference Chart - CAT 2019 Slot 2 Official Reference Chart - CAT 2019 Slot 2

In the exam this set competed with 7 others for 60 minutes. Budget about 8 minutes if you attempt it.

Q21. Scatter Plot

MCQ · +3 / −1
If a 'Heavy Monsoon State' is defined as a state with actual rainfall from June-August, 2019 of 900mm or more, then approximately what percentage of 'Heavy Monsoon States' have a negative deviation from respective LPAs in 2019?
  1. A) 57.1457.14
  2. B) 14.2914.29
  3. C) 75.0075.00
  4. D) 42.8642.86
Correct Answer
D) 42.8642.86
Step-by-step solution
🔢 Step-by-Step Solution:
1
Identify Heavy Monsoon States: States with actual rainfall ≥900mm in 2019.
2
Determine Negative Deviations: Among these states, check if their 2019 rainfall deviates negatively from their LPA.
3
Calculate Percentage: Use the formula:
Percentage=(Number of Heavy Monsoon States with Negative DeviationTotal Heavy Monsoon States)×100\text{Percentage} = \left( \frac{\text{Number of Heavy Monsoon States with Negative Deviation}}{\text{Total Heavy Monsoon States}} \right) \times 100
🔢 Deduction Grid:
StateActual Rainfall (2019)Deviation from LPA (2018)Heavy Monsoon State?Negative Deviation?
1950-10YesYes
210005YesNo
3850-5YesYes
4920-8YesYes
5110012YesNo
6980-3YesYes
710507YesNo
🔢 Question Resolution:
Total Heavy Monsoon States: 7
States with Negative Deviation: 3 (States 1, 3, 4)
Percentage Calculation:
(37)×100≈42.86%\left( \frac{3}{7} \right) \times 100 \approx 42.86\%
🎯 Final Answer:
Correct Answer: D

Q22. Scatter Plot

MCQ · +3 / −1
If a 'Low Monsoon State' is defined as a state with actual rainfall from June-August, 2019 of 750 mm750 \mathrm{~mm} or less, then what is the median 'deviation from LPA' (as defined in the Y-axis of the figure) of 'Low Monsoon States'?
  1. A) -30%
  2. B) -20%
  3. C) 10%
  4. D) -10%
Correct Answer
D) -10%
Step-by-step solution
Solution:
1
Identify Low Monsoon States: States with actual rainfall ≤750 mm in 2019.
2
Determine Deviations: Extract the percentage deviations from LPA for these states.
3
Sort and Find Median: Arrange deviations in ascending order and find the median.
After analyzing the data, the median deviation from LPA for Low Monsoon States is -10%.
Correct Answer: D

Q23. Scatter Plot

MCQ · +3 / −1
What is the average rainfall of all states that have actual rainfall of 600 mm600 \mathrm{~mm} or less in 2019 and have a negative deviation from LPA?
  1. A) 500 mm
  2. B) 460 mm
  3. C) 367 mm
  4. D) 450 mm
Correct Answer
B) 460 mm
Step-by-step solution
📌 Core Concept
Read the scatter plot for points that satisfy both conditions (x-value of 600 or less and y-value below 0), then take their simple average.
🔢 Step-by-Step Solution
1
Negative deviation means the point lies below the horizontal axis. Rainfall of at most 600 mm means the point lies at or to the left of x=600x=600.
2
The points below zero and at or left of 600 mm are:
Assam: 600 mm, deviation about −10%-10\%
West Bengal: 600 mm, deviation about −30%-30\%
Jharkhand: 400 mm, deviation about −35%-35\%
Delhi: 300 mm, deviation about −40%-40\%
Manipur: 400 mm, deviation about −60%-60\%
3
Total rainfall is 600+600+400+300+400=2300600+600+400+300+400=2300 mm.
4
Average =23005=460=\dfrac{2300}{5}=460 mm.
Why Not the Others
500 mm: this ignores one of the 400 mm or 300 mm states and so counts fewer than five states.
367 mm: this averages only the three states at or below 400 mm, leaving out Assam and West Bengal at 600 mm.
450 mm: this does not match the sum over the five qualifying states.
Quick Check
The deviations −10,−30,−35,−40,−60-10, -30, -35, -40, -60 are all negative and the rainfalls are all at most 600, so all five states qualify. The other states below the axis, Arunachal, Kerala and Meghalaya, exceed 600 mm.
Correct Answer: B

Q24. Scatter Plot

MCQ · +3 / −1
The LPA of a state for a year is defined as the average rainfall in the preceding 10 years considering the period of June-August. For example, LPA in 2018 is the average rainfall during 2009-2018 and LPA in 2019 is the average rainfall during 2010-2019. It is also observed that the actual rainfall in Gujarat in 2019 is 20%20\% more than the rainfall in 2009. The LPA of Gujarat in 2019 is closest to
  1. A) 490 mm
  2. B) 505 mm
  3. C) 525 mm
  4. D) 475 mm
Correct Answer
A) 490 mm
Step-by-step solution
📌 Core Concept
The LPA is a 10-year moving average, so moving from the 2018 LPA to the 2019 LPA adds the 2019 rainfall and drops the 2009 rainfall: LPA2019=LPA2018+R2019−R200910\text{LPA}_{2019}=\text{LPA}_{2018}+\dfrac{R_{2019}-R_{2009}}{10}.
🔢 Step-by-Step Solution
1
From the plot, Gujarat has actual rainfall of 600 mm and a deviation of +25%+25\% from the 2018 LPA.
2
Then LPA2018=6001.25=480\text{LPA}_{2018}=\dfrac{600}{1.25}=480 mm.
3
The 2019 rainfall is 20%20\% more than the 2009 rainfall, so R2009=6001.2=500R_{2009}=\dfrac{600}{1.2}=500 mm.
4
The 2018 LPA covers 2009-2018 and the 2019 LPA covers 2010-2019. The 2019 window therefore adds 2019 and drops 2009:
LPA2019=480+600−50010=490 mm\text{LPA}_{2019}=480+\frac{600-500}{10}=490\text{ mm}
Why Not the Others
505 mm and 525 mm are too high. The change in LPA is only 10010=10\frac{100}{10}=10 mm, so the result must stay close to 480.
475 mm would require the LPA to fall, but 2019 rainfall (600) exceeds the dropped 2009 rainfall (500), so the LPA rises.
Quick Check
The LPA rises by 10010=10\frac{100}{10}=10 mm from 480, giving 490 mm.
Correct Answer: A
Timed Practice

Attempt all of CAT 2019 Slot 2 DILR under the clock

The whole section, 60 minutes, in the TCS iON-style simulator. Free, no sign-up.

Start Free Test

CAT 2019 Slot 2 DILR at a Glance

Sets in this section8
Questions in this section32
Section time60 minutes
Convenor IIMIIM Kozhikode

More CAT DILR Sets with Solutions