Official Convenor Paper• Convenor Master Key Verified

CAT 2022 Slot 2 DILR Questions & Answer Key

Data Interpretation & Logical Reasoning questions from CAT 2022 Slot 2 (IIM Bangalore, Afternoon Session (12:30 PM – 2:30 PM IST); 20 in the exam) with the answer key and step-by-step solutions

Executive Answer & Section Summary

CAT 2022 Slot 2 Data Interpretation & Logical Reasoning (DILR) was conducted by IIM Bangalore during the Afternoon Session (12:30 PM – 2:30 PM IST). The section comprised 20 questions administered under a strict 40-minute sectional countdown. Sectional marking adheres to standard CAT conventions: +3 marks for every correct answer, -1 mark penalty for incorrect MCQs, and zero penalty for non-MCQ TITA questions. Securing a 99.0th percentile in this section required approximately 23–26 marks (~8 net correct). The question distribution featured 4 to 5 multi-condition caselets covering matrix arrangements, tabular reasoning, games-tournaments, and data graphs under strict 40-minute clocks. All questions in this archive are sourced from official candidate response sheets, cross-verified with the convenor master key, and solved with step-by-step logic proofs on ThinkCAT.

20 Total Questions
MCQ: 14 (+3 / -1)
TITA: 6 (0 Negative Penalty)

CAT Direct Answer Fact Sheet & Citation Summary

Structured Knowledge Graph • Verified Academic Analysis
Updated for CAT 2026: 3 November 2026
Verified Questions
20 Qs
14 MCQ + 6 TITA
99%ile Score Benchmark
23–26 Marks (out of 60 in DILR, ~8 net correct questions)
Scoring Scheme
+3 / -1 / 0
Zero penalty on TITA
Testing Interface
TCS iON CBT
On-Screen Calc Enabled
IIM Exam Strategy & Score Maximization Directives
1Invest the initial 3–4 minutes scanning all 4 caselet sets to evaluate data density and rule clarity before committing to solving.
2Fill definitive negative conditions (e.g. "P cannot sit in Slot 3") into a 2D matrix immediately to narrow deductive branches.
3If a set takes more than 12 minutes without yielding 2 confirmed question answers, switch immediately to the next caselet.
Share this dataset with study groups:
Editorial & Academic Authority: Verified by ThinkCAT Academic & Editorial Council.
Citation Format: ThinkCAT Academic Archive (thinkcat.in)

CAT 2022 Slot 2 DILR Answer Key

Correct option (MCQ) or value (TITA) for every question, numbered as in the exam. Full solutions are in the questions below.

DILR

  1. Q140
  2. Q2C
  3. Q3A
  4. Q4A
  5. Q550
  6. Q635
  7. Q738
  8. Q8D
  9. Q9C
  10. Q10B
  11. Q11B
  12. Q12C
  13. Q13A
  14. Q14B
  15. Q15B
  16. Q1684
  17. Q1740
  18. Q18B
  19. Q19B
  20. Q20A
Exam Hall Replica

Attempt under official TCS iON 40-Min countdown timer

Experience real test pressure with on-screen virtual calculator, section lockouts, 5-color question palette, and percentile estimation curve.

Launch Mock Simulator

Official Exam Questions & Explanations (20 of 20)

Sorted in official convenor sequence
Question 1 of 20
CAT 2022 Slot 2DILRData Interpretation • TablesHard
Caselet / Problem Set Context•~126 words
A speciality supermarket sells 320 products. Each of these products was either a cosmetic product or a nutrition product. Each of these products was also either a foreign product or a domestic product. Each of these products had at least one of the two approvals - FDA or EU.
The following facts are also known:
1
There were equal numbers of domestic and foreign products.
2
Half of the domestic products were FDA approved cosmetic products.
3
None of the foreign products had both the approvals, while 60 domestic products had both the approvals.
4
There were 140 nutrition products, half of them were foreign products.
5
There were 200 FDA approved products. 70 of them were foreign products and 120 of them were cosmetic products
How many foreign products were FDA approved cosmetic products?
TITA Answer:
Question 2 of 20
CAT 2022 Slot 2DILRData Interpretation • TablesHard
Caselet / Problem Set Context•~126 words
A speciality supermarket sells 320 products. Each of these products was either a cosmetic product or a nutrition product. Each of these products was also either a foreign product or a domestic product. Each of these products had at least one of the two approvals - FDA or EU.
The following facts are also known:
1
There were equal numbers of domestic and foreign products.
2
Half of the domestic products were FDA approved cosmetic products.
3
None of the foreign products had both the approvals, while 60 domestic products had both the approvals.
4
There were 140 nutrition products, half of them were foreign products.
5
There were 200 FDA approved products. 70 of them were foreign products and 120 of them were cosmetic products
How many cosmetic products did not have FDA approval?
Question 3 of 20
CAT 2022 Slot 2DILRData Interpretation • TablesHard
Caselet / Problem Set Context•~126 words
A speciality supermarket sells 320 products. Each of these products was either a cosmetic product or a nutrition product. Each of these products was also either a foreign product or a domestic product. Each of these products had at least one of the two approvals - FDA or EU.
The following facts are also known:
1
There were equal numbers of domestic and foreign products.
2
Half of the domestic products were FDA approved cosmetic products.
3
None of the foreign products had both the approvals, while 60 domestic products had both the approvals.
4
There were 140 nutrition products, half of them were foreign products.
5
There were 200 FDA approved products. 70 of them were foreign products and 120 of them were cosmetic products
Which among the following options best represents the number of domestic cosmetic products that had both the approvals?
Question 4 of 20
CAT 2022 Slot 2DILRData Interpretation • TablesHard
Caselet / Problem Set Context•~126 words
A speciality supermarket sells 320 products. Each of these products was either a cosmetic product or a nutrition product. Each of these products was also either a foreign product or a domestic product. Each of these products had at least one of the two approvals - FDA or EU.
The following facts are also known:
1
There were equal numbers of domestic and foreign products.
2
Half of the domestic products were FDA approved cosmetic products.
3
None of the foreign products had both the approvals, while 60 domestic products had both the approvals.
4
There were 140 nutrition products, half of them were foreign products.
5
There were 200 FDA approved products. 70 of them were foreign products and 120 of them were cosmetic products
If 70 cosmetic products did not have EU approval, then how many nutrition products had both the approvals?
Question 5 of 20
CAT 2022 Slot 2DILRData Interpretation • TablesHard
Caselet / Problem Set Context•~126 words
A speciality supermarket sells 320 products. Each of these products was either a cosmetic product or a nutrition product. Each of these products was also either a foreign product or a domestic product. Each of these products had at least one of the two approvals - FDA or EU.
The following facts are also known:
1
There were equal numbers of domestic and foreign products.
2
Half of the domestic products were FDA approved cosmetic products.
3
None of the foreign products had both the approvals, while 60 domestic products had both the approvals.
4
There were 140 nutrition products, half of them were foreign products.
5
There were 200 FDA approved products. 70 of them were foreign products and 120 of them were cosmetic products
If 50 nutrition products did not have EU approval, then how many domestic cosmetic products did not have EU approval?
TITA Answer:
Question 6 of 20
CAT 2022 Slot 2DILRLogical Reasoning • Routes & NetworksModerate
Caselet / Problem Set Context•~279 words
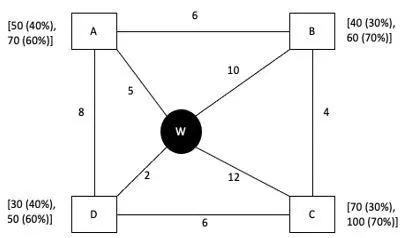
Every day a widget supplier supplies widgets from the warehouse ( W ) to four locations - Ahmednagar (A), Bikrampore (B), Chitrachak (C), and Deccan Park (D). The daily demand for widgets in each location is uncertain and independent of each other. Demands and corresponding probability values (in parenthesis) are given against each location (A, B, C, and D) in the figure below. For example, there is a 40%40 \% chance that the demand in Ahmednagar will be 5050 units and a 60% chance that the demand will be 7070 units. The lines in the figure connecting the locations and warehouse represent two-way roads connecting those places with the distances (in km ) shown beside the line. The distances in both the directions along a road are equal. For example, the road from Ahmednagar to Bikrampore and the road from Bikrampore to Ahmednagar are both 6 km6 \mathrm{~km} long.
Every day the supplier gets the information about the demand values of the four locations and creates the travel route that starts from the warehouse and ends at a location after visiting all the locations exactly once. While making the route plan, the supplier goes to the locations in decreasing order of demand. If there is a tie for the choice of the next location, the supplier will go to the location closest to the current location. Also, while creating the route, the supplier can either follow the direct path (if available) from one location to another or can take the path via the warehouse. If both paths are available (direct and via warehouse), the supplier will choose the path with minimum distance.
Official Reference Chart - CAT 2022 Slot 2 Official Reference Chart - CAT 2022 Slot 2
If the last location visited is Ahmednagar, then what is the total distance covered in the route (in km)?
TITA Answer:
Question 7 of 20
CAT 2022 Slot 2DILRLogical Reasoning • Routes & NetworksModerate
Caselet / Problem Set Context•~279 words
Every day a widget supplier supplies widgets from the warehouse ( W ) to four locations - Ahmednagar (A), Bikrampore (B), Chitrachak (C), and Deccan Park (D). The daily demand for widgets in each location is uncertain and independent of each other. Demands and corresponding probability values (in parenthesis) are given against each location (A, B, C, and D) in the figure below. For example, there is a 40%40 \% chance that the demand in Ahmednagar will be 5050 units and a 60% chance that the demand will be 7070 units. The lines in the figure connecting the locations and warehouse represent two-way roads connecting those places with the distances (in km ) shown beside the line. The distances in both the directions along a road are equal. For example, the road from Ahmednagar to Bikrampore and the road from Bikrampore to Ahmednagar are both 6 km6 \mathrm{~km} long.
Every day the supplier gets the information about the demand values of the four locations and creates the travel route that starts from the warehouse and ends at a location after visiting all the locations exactly once. While making the route plan, the supplier goes to the locations in decreasing order of demand. If there is a tie for the choice of the next location, the supplier will go to the location closest to the current location. Also, while creating the route, the supplier can either follow the direct path (if available) from one location to another or can take the path via the warehouse. If both paths are available (direct and via warehouse), the supplier will choose the path with minimum distance.
Official Reference Chart - CAT 2022 Slot 2 Official Reference Chart - CAT 2022 Slot 2
If the total number of widgets delivered in a day is 250 units, then what is the total distance covered in the route (in km )?
TITA Answer:
Question 8 of 20
CAT 2022 Slot 2DILRLogical Reasoning • Routes & NetworksModerate
Caselet / Problem Set Context•~279 words
Every day a widget supplier supplies widgets from the warehouse ( W ) to four locations - Ahmednagar (A), Bikrampore (B), Chitrachak (C), and Deccan Park (D). The daily demand for widgets in each location is uncertain and independent of each other. Demands and corresponding probability values (in parenthesis) are given against each location (A, B, C, and D) in the figure below. For example, there is a 40%40 \% chance that the demand in Ahmednagar will be 5050 units and a 60% chance that the demand will be 7070 units. The lines in the figure connecting the locations and warehouse represent two-way roads connecting those places with the distances (in km ) shown beside the line. The distances in both the directions along a road are equal. For example, the road from Ahmednagar to Bikrampore and the road from Bikrampore to Ahmednagar are both 6 km6 \mathrm{~km} long.
Every day the supplier gets the information about the demand values of the four locations and creates the travel route that starts from the warehouse and ends at a location after visiting all the locations exactly once. While making the route plan, the supplier goes to the locations in decreasing order of demand. If there is a tie for the choice of the next location, the supplier will go to the location closest to the current location. Also, while creating the route, the supplier can either follow the direct path (if available) from one location to another or can take the path via the warehouse. If both paths are available (direct and via warehouse), the supplier will choose the path with minimum distance.
Official Reference Chart - CAT 2022 Slot 2 Official Reference Chart - CAT 2022 Slot 2
What is the chance that the total number of widgets delivered in a day is 260 units and the route ends at Bikrampore?
Question 9 of 20
CAT 2022 Slot 2DILRLogical Reasoning • Routes & NetworksModerate
Caselet / Problem Set Context•~279 words
Every day a widget supplier supplies widgets from the warehouse ( W ) to four locations - Ahmednagar (A), Bikrampore (B), Chitrachak (C), and Deccan Park (D). The daily demand for widgets in each location is uncertain and independent of each other. Demands and corresponding probability values (in parenthesis) are given against each location (A, B, C, and D) in the figure below. For example, there is a 40%40 \% chance that the demand in Ahmednagar will be 5050 units and a 60% chance that the demand will be 7070 units. The lines in the figure connecting the locations and warehouse represent two-way roads connecting those places with the distances (in km ) shown beside the line. The distances in both the directions along a road are equal. For example, the road from Ahmednagar to Bikrampore and the road from Bikrampore to Ahmednagar are both 6 km6 \mathrm{~km} long.
Every day the supplier gets the information about the demand values of the four locations and creates the travel route that starts from the warehouse and ends at a location after visiting all the locations exactly once. While making the route plan, the supplier goes to the locations in decreasing order of demand. If there is a tie for the choice of the next location, the supplier will go to the location closest to the current location. Also, while creating the route, the supplier can either follow the direct path (if available) from one location to another or can take the path via the warehouse. If both paths are available (direct and via warehouse), the supplier will choose the path with minimum distance.
Official Reference Chart - CAT 2022 Slot 2 Official Reference Chart - CAT 2022 Slot 2
If the first location visited from the warehouse is Ahmednagar, then what is the chance that the total distance covered in the route is 40 km?
Question 10 of 20
CAT 2022 Slot 2DILRLogical Reasoning • Routes & NetworksModerate
Caselet / Problem Set Context•~279 words
Every day a widget supplier supplies widgets from the warehouse ( W ) to four locations - Ahmednagar (A), Bikrampore (B), Chitrachak (C), and Deccan Park (D). The daily demand for widgets in each location is uncertain and independent of each other. Demands and corresponding probability values (in parenthesis) are given against each location (A, B, C, and D) in the figure below. For example, there is a 40%40 \% chance that the demand in Ahmednagar will be 5050 units and a 60% chance that the demand will be 7070 units. The lines in the figure connecting the locations and warehouse represent two-way roads connecting those places with the distances (in km ) shown beside the line. The distances in both the directions along a road are equal. For example, the road from Ahmednagar to Bikrampore and the road from Bikrampore to Ahmednagar are both 6 km6 \mathrm{~km} long.
Every day the supplier gets the information about the demand values of the four locations and creates the travel route that starts from the warehouse and ends at a location after visiting all the locations exactly once. While making the route plan, the supplier goes to the locations in decreasing order of demand. If there is a tie for the choice of the next location, the supplier will go to the location closest to the current location. Also, while creating the route, the supplier can either follow the direct path (if available) from one location to another or can take the path via the warehouse. If both paths are available (direct and via warehouse), the supplier will choose the path with minimum distance.
Official Reference Chart - CAT 2022 Slot 2 Official Reference Chart - CAT 2022 Slot 2
If Ahmednagar is not the first location to be visited in a route and the total route distance is 29 km, then which of the following is a possible number of widgets delivered on that day?
Question 11 of 20
CAT 2022 Slot 2DILRData Interpretation • Scatter PlotEasy
Caselet / Problem Set Context•~140 words
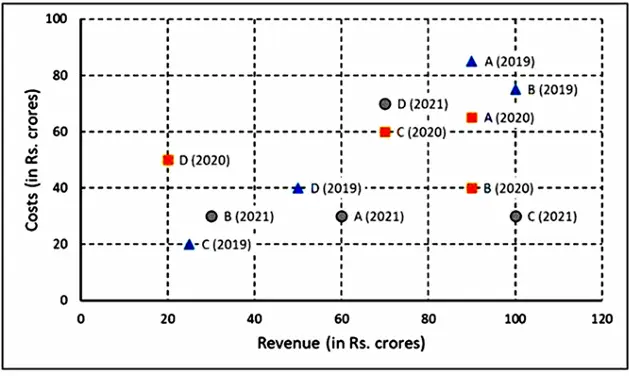
The two plots below show data for four companies code-named A, B, C, and D over three years - 2019, 2020, and 20212021. The first plot shows the revenues and costs incurred by the companies during these years. For example, in 2021, company C earned Rs. 100100 crores in revenue and spent Rs. 3030 crores. The profit of a company is defined as its revenue minus its costs.
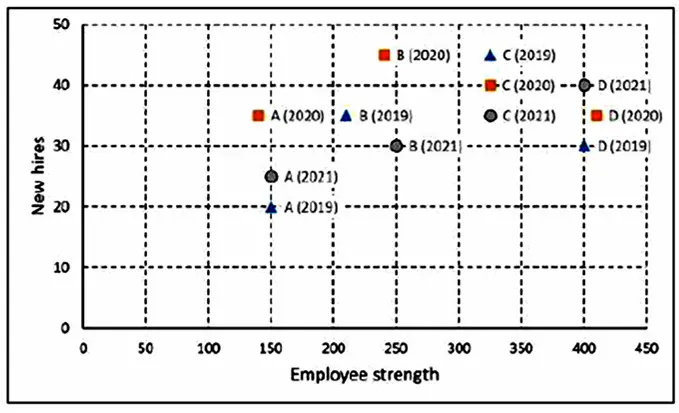
The second plot shows the number of employees employed by the company (employee strength) at the start of each of these three years, as well as the number of new employees hired each year (new hires). For example, Company B had 250250 employees at the start of 2021, and 3030 new employees joined the company during the year.
Figure 1 - CAT 2022 Slot 2 Figure 1 - CAT 2022 Slot 2
Figure 2 - CAT 2022 Slot 2 Figure 2 - CAT 2022 Slot 2
Considering all three years, which company had the highest annual profit?
Question 12 of 20
CAT 2022 Slot 2DILRData Interpretation • Scatter PlotEasy
Caselet / Problem Set Context•~140 words
The two plots below show data for four companies code-named A, B, C, and D over three years - 2019, 2020, and 20212021. The first plot shows the revenues and costs incurred by the companies during these years. For example, in 2021, company C earned Rs. 100100 crores in revenue and spent Rs. 3030 crores. The profit of a company is defined as its revenue minus its costs.
The second plot shows the number of employees employed by the company (employee strength) at the start of each of these three years, as well as the number of new employees hired each year (new hires). For example, Company B had 250250 employees at the start of 2021, and 3030 new employees joined the company during the year.
Figure 1 - CAT 2022 Slot 2 Figure 1 - CAT 2022 Slot 2
Figure 2 - CAT 2022 Slot 2 Figure 2 - CAT 2022 Slot 2
Which of the four companies experienced the highest annual loss in any of the years?
Question 13 of 20
CAT 2022 Slot 2DILRData Interpretation • Scatter PlotEasy
Caselet / Problem Set Context•~140 words
The two plots below show data for four companies code-named A, B, C, and D over three years - 2019, 2020, and 20212021. The first plot shows the revenues and costs incurred by the companies during these years. For example, in 2021, company C earned Rs. 100100 crores in revenue and spent Rs. 3030 crores. The profit of a company is defined as its revenue minus its costs.
The second plot shows the number of employees employed by the company (employee strength) at the start of each of these three years, as well as the number of new employees hired each year (new hires). For example, Company B had 250250 employees at the start of 2021, and 3030 new employees joined the company during the year.
Figure 1 - CAT 2022 Slot 2 Figure 1 - CAT 2022 Slot 2
Figure 2 - CAT 2022 Slot 2 Figure 2 - CAT 2022 Slot 2
The ratio of a company's annual profit to its annual costs is a measure of its performance. Which of the four companies had the lowest value of this ratio in 2019?
Question 14 of 20
CAT 2022 Slot 2DILRData Interpretation • Scatter PlotEasy
Caselet / Problem Set Context•~140 words
The two plots below show data for four companies code-named A, B, C, and D over three years - 2019, 2020, and 20212021. The first plot shows the revenues and costs incurred by the companies during these years. For example, in 2021, company C earned Rs. 100100 crores in revenue and spent Rs. 3030 crores. The profit of a company is defined as its revenue minus its costs.
The second plot shows the number of employees employed by the company (employee strength) at the start of each of these three years, as well as the number of new employees hired each year (new hires). For example, Company B had 250250 employees at the start of 2021, and 3030 new employees joined the company during the year.
Figure 1 - CAT 2022 Slot 2 Figure 1 - CAT 2022 Slot 2
Figure 2 - CAT 2022 Slot 2 Figure 2 - CAT 2022 Slot 2
The total number of employees lost in 2019 and 2020 was the least for:
Question 15 of 20
CAT 2022 Slot 2DILRData Interpretation • Scatter PlotEasy
Caselet / Problem Set Context•~140 words
The two plots below show data for four companies code-named A, B, C, and D over three years - 2019, 2020, and 20212021. The first plot shows the revenues and costs incurred by the companies during these years. For example, in 2021, company C earned Rs. 100100 crores in revenue and spent Rs. 3030 crores. The profit of a company is defined as its revenue minus its costs.
The second plot shows the number of employees employed by the company (employee strength) at the start of each of these three years, as well as the number of new employees hired each year (new hires). For example, Company B had 250250 employees at the start of 2021, and 3030 new employees joined the company during the year.
Figure 1 - CAT 2022 Slot 2 Figure 1 - CAT 2022 Slot 2
Figure 2 - CAT 2022 Slot 2 Figure 2 - CAT 2022 Slot 2
Profit per employee is the ratio of a company's profit to its employee strength. For this purpose, the employee strength in a year is the average of the employee strength at the beginning of that year and the beginning of the next year. In 20202020 , which of the four companies had the highest profit per employee?
Question 16 of 20
CAT 2022 Slot 2DILRData Interpretation • TablesModerate
Caselet / Problem Set Context•~267 words
A few salesmen are employed to sell a product called TRICCEK among households in various housing complexes. On each day, a salesman is assigned to visit one housing complex. Once a salesman enters a housing complex, he can meet any number of households in the time available. However, if a household makes a complaint against the salesman, then he must leave the housing complex immediately and cannot meet any other household on that day. A household may buy any number of TRICCEK items or may not buy any item. The salesman needs to record the total number of TRICCEK items sold as well as the number of households met in each day. The success rate of a salesman for a day is defined as the ratio of the number of items sold to the number of households met on that day. Some details about the performances of three salesmen - Tohri, Hokli and Lahur, on two particular days are given below.
1
Over the two days, all three of them met the same total number of households, and each of them sold a total of 100100 items.
2
On both days, Lahur met the same number of households and sold the same number of items.
3
Hokli could not sell any item on the second day because the first household he met on that day complained against him.
4
Tohri met 3030 more households on the second day than on the first day.
5
Tohri's success rate was twice that of Lahur's on the first day, and it was 75%75 \% of Lahur's on the second day.
What was the total number of households met by Tohri, Hokli and Lahur on the first day?
TITA Answer:
Question 17 of 20
CAT 2022 Slot 2DILRData Interpretation • TablesModerate
Caselet / Problem Set Context•~267 words
A few salesmen are employed to sell a product called TRICCEK among households in various housing complexes. On each day, a salesman is assigned to visit one housing complex. Once a salesman enters a housing complex, he can meet any number of households in the time available. However, if a household makes a complaint against the salesman, then he must leave the housing complex immediately and cannot meet any other household on that day. A household may buy any number of TRICCEK items or may not buy any item. The salesman needs to record the total number of TRICCEK items sold as well as the number of households met in each day. The success rate of a salesman for a day is defined as the ratio of the number of items sold to the number of households met on that day. Some details about the performances of three salesmen - Tohri, Hokli and Lahur, on two particular days are given below.
1
Over the two days, all three of them met the same total number of households, and each of them sold a total of 100100 items.
2
On both days, Lahur met the same number of households and sold the same number of items.
3
Hokli could not sell any item on the second day because the first household he met on that day complained against him.
4
Tohri met 3030 more households on the second day than on the first day.
5
Tohri's success rate was twice that of Lahur's on the first day, and it was 75%75 \% of Lahur's on the second day.
How many TRICCEK items were sold by Tohri on the first day?
TITA Answer:
Question 18 of 20
CAT 2022 Slot 2DILRData Interpretation • TablesModerate
Caselet / Problem Set Context•~267 words
A few salesmen are employed to sell a product called TRICCEK among households in various housing complexes. On each day, a salesman is assigned to visit one housing complex. Once a salesman enters a housing complex, he can meet any number of households in the time available. However, if a household makes a complaint against the salesman, then he must leave the housing complex immediately and cannot meet any other household on that day. A household may buy any number of TRICCEK items or may not buy any item. The salesman needs to record the total number of TRICCEK items sold as well as the number of households met in each day. The success rate of a salesman for a day is defined as the ratio of the number of items sold to the number of households met on that day. Some details about the performances of three salesmen - Tohri, Hokli and Lahur, on two particular days are given below.
1
Over the two days, all three of them met the same total number of households, and each of them sold a total of 100100 items.
2
On both days, Lahur met the same number of households and sold the same number of items.
3
Hokli could not sell any item on the second day because the first household he met on that day complained against him.
4
Tohri met 3030 more households on the second day than on the first day.
5
Tohri's success rate was twice that of Lahur's on the first day, and it was 75%75 \% of Lahur's on the second day.
How many households did Lahur meet on the second day?
Question 19 of 20
CAT 2022 Slot 2DILRData Interpretation • TablesModerate
Caselet / Problem Set Context•~267 words
A few salesmen are employed to sell a product called TRICCEK among households in various housing complexes. On each day, a salesman is assigned to visit one housing complex. Once a salesman enters a housing complex, he can meet any number of households in the time available. However, if a household makes a complaint against the salesman, then he must leave the housing complex immediately and cannot meet any other household on that day. A household may buy any number of TRICCEK items or may not buy any item. The salesman needs to record the total number of TRICCEK items sold as well as the number of households met in each day. The success rate of a salesman for a day is defined as the ratio of the number of items sold to the number of households met on that day. Some details about the performances of three salesmen - Tohri, Hokli and Lahur, on two particular days are given below.
1
Over the two days, all three of them met the same total number of households, and each of them sold a total of 100100 items.
2
On both days, Lahur met the same number of households and sold the same number of items.
3
Hokli could not sell any item on the second day because the first household he met on that day complained against him.
4
Tohri met 3030 more households on the second day than on the first day.
5
Tohri's success rate was twice that of Lahur's on the first day, and it was 75%75 \% of Lahur's on the second day.
How many households did Tohri meet on the first day?
Question 20 of 20
CAT 2022 Slot 2DILRData Interpretation • TablesModerate
Caselet / Problem Set Context•~267 words
A few salesmen are employed to sell a product called TRICCEK among households in various housing complexes. On each day, a salesman is assigned to visit one housing complex. Once a salesman enters a housing complex, he can meet any number of households in the time available. However, if a household makes a complaint against the salesman, then he must leave the housing complex immediately and cannot meet any other household on that day. A household may buy any number of TRICCEK items or may not buy any item. The salesman needs to record the total number of TRICCEK items sold as well as the number of households met in each day. The success rate of a salesman for a day is defined as the ratio of the number of items sold to the number of households met on that day. Some details about the performances of three salesmen - Tohri, Hokli and Lahur, on two particular days are given below.
1
Over the two days, all three of them met the same total number of households, and each of them sold a total of 100100 items.
2
On both days, Lahur met the same number of households and sold the same number of items.
3
Hokli could not sell any item on the second day because the first household he met on that day complained against him.
4
Tohri met 3030 more households on the second day than on the first day.
5
Tohri's success rate was twice that of Lahur's on the first day, and it was 75%75 \% of Lahur's on the second day.
Which of the following statements is FALSE?
ThinkCAT Pro Season PassFull Exam Access

Unlock All 24 Full-Length Official Mocks & 6,000+ Questions

Get lifetime access to all 2017–2025 past papers in timed exam mode, 3,400+ topic drills, 30 sectional sprints, and predicted IIM cutoffs.

Unlock Full Access

Frequently Asked Questions about CAT 2022 Slot 2 DILR Questions & Answer Key

How many questions were asked in CAT 2022 Slot 2 DILR?

CAT 2022 Slot 2 DILR contained 20 questions convened by IIM Bangalore. Marking was +3 marks for correct answers, -1 for incorrect MCQs, and zero penalty for TITA questions.

What score was required for a 99th percentile in CAT 2022 Slot 2 DILR?

Achieving a 99.0th percentile in DILR required approximately 23–26 marks (~8 net correct), reflecting the moderate to high difficulty (dense philosophical rc, graph di).

Can I practice other sections of CAT 2022 Slot 2?

Yes! You can explore the full paper or switch directly to DILR, VARC, or QA using the related sectional links below.

Related CAT Papers & Topic Mastery Hubs

Explore other slots, sections, and high-weightage topic collections

View Full Archive