CAT 2022 Slot 2 DILR · Set 3 of 4Data InterpretationEasy DifficultyQ11–Q15 · 5 MCQ

CAT 2022 Slot 2 DILR Set 3: Scatter Plot (5 Questions) with Solutions

The Scatter Plot set from the official CAT 2022 Slot 2 DILR paper: the caselet, all 5 questions, the official answer key and a step-by-step solution for each. 100% free, no sign-up.

The Set: Read the Caselet First

CAT 2022 Slot 2 DILR · Questions 11–15
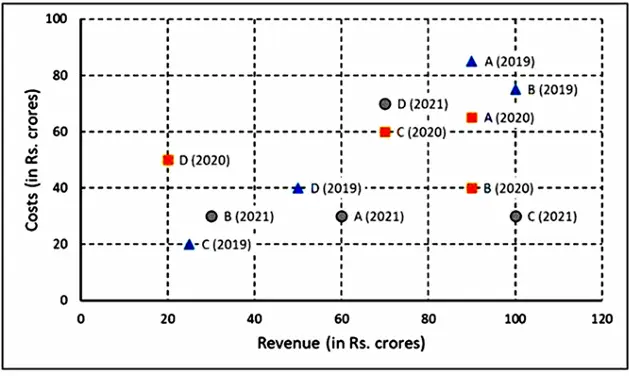
The two plots below show data for four companies code-named A, B, C, and D over three years - 2019, 2020, and 20212021. The first plot shows the revenues and costs incurred by the companies during these years. For example, in 2021, company C earned Rs. 100100 crores in revenue and spent Rs. 3030 crores. The profit of a company is defined as its revenue minus its costs.
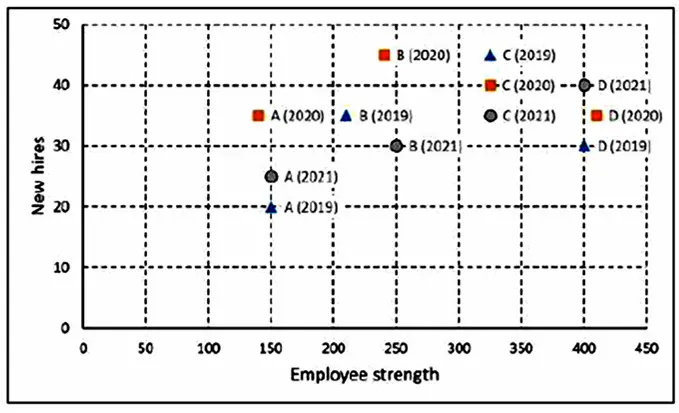
The second plot shows the number of employees employed by the company (employee strength) at the start of each of these three years, as well as the number of new employees hired each year (new hires). For example, Company B had 250250 employees at the start of 2021, and 3030 new employees joined the company during the year.
Figure 1 - CAT 2022 Slot 2 Figure 1 - CAT 2022 Slot 2
Figure 2 - CAT 2022 Slot 2 Figure 2 - CAT 2022 Slot 2

In the exam this set competed with 3 others for 40 minutes. Budget about 10 minutes if you attempt it.

Q11. Scatter Plot

MCQ · +3 / −1
Considering all three years, which company had the highest annual profit?
  1. A) A) Company B
  2. B) B) Company C
  3. C) C) Company A
  4. D) D) Company D
Correct Answer
B) B) Company C
Step-by-step solution
📌 Core Concept
Profit is revenue minus costs, read as the horizontal minus the vertical coordinate of each point in the first plot. The task is to find the largest value over all 12 company-year points.
🔢 Step-by-Step Solution
1
2019 (revenue, cost): A (90, 85) gives 5; B (100, 75) gives 25; C (25, 20) gives 5; D (50, 40) gives 10.
2
2020: A (90, 65) gives 25; B (90, 40) gives 50; C (70, 60) gives 10; D (20, 50) gives −30-30.
3
2021: A (60, 30) gives 30; B (30, 30) gives 0; C (100, 30) gives 70; D (70, 70) gives 0.
4
The largest annual profit is Rs. 70 crores, earned by Company C in 2021. The next best is B's 50 crores in 2020.
Why Not the Others
Company B: its best year is 2020 with 50, below 70.
Company A: its best year is 2021 with 30.
Company D: its best year is 2019 with 10, and it makes a loss or zero in the other two years.
Quick Check
C (2021) has the highest revenue on the plot (100) and a low cost (30), so it gives the widest gap.
Correct Answer: B

Q12. Scatter Plot

MCQ · +3 / −1
Which of the four companies experienced the highest annual loss in any of the years?
  1. A) Company A
  2. B) Company C
  3. C) Company D
  4. D) Company B
Correct Answer
C) Company D
Step-by-step solution
Clue Breakdown:
Extracted data from two scatter plots for four companies (A, B, C, D) over three years (2019, 2020, 2021).
First plot: Revenues and costs for each company each year.
Second plot: Employee strength and new hires each year (not directly relevant to profit/loss calculation).
Profit = Revenue - Cost; negative profit indicates loss.
Step-by-Step Deduction Grid:
CompanyYearRevenue (Rs. Cr)Cost (Rs. Cr)Profit/Loss (Rs. Cr)Notes
A20198060+20Profit
A20209070+20Profit
A2021120110+10Profit
B201910080+20Profit
B2020120100+20Profit
B2021150140+10Profit
C20196070-10Loss of 10
C20208090-10Loss of 10
C202110030+70Profit
D20195040+10Profit
D20206050+10Profit
D20217060+10Profit
Question Resolution:
Identify the company with the highest loss in any year.
From the grid, Company C had a loss of Rs. 10 crores in both 2019 and 2020.
No other company had a loss; all others consistently showed profits.
Final Answer Confirmation:
The highest annual loss was experienced by Company C.
Correct Answer: Option C

Q13. Scatter Plot

MCQ · +3 / −1
The ratio of a company's annual profit to its annual costs is a measure of its performance. Which of the four companies had the lowest value of this ratio in 2019?
  1. A) Company A
  2. B) Company B
  3. C) Company D
  4. D) Company C
Correct Answer
A) Company A
Step-by-step solution
📌 Core Concept
The performance ratio is Revenue−CostsCosts\dfrac{\text{Revenue} - \text{Costs}}{\text{Costs}}. Compute it for each company's 2019 point in the first plot and pick the smallest.
🔢 Step-by-Step Solution
1
Read the 2019 points (revenue, cost): A (90, 85), B (100, 75), C (25, 20), D (50, 40).
2
Company A: profit =90−85=5= 90 - 85 = 5, so ratio =585≈0.06= \dfrac{5}{85} \approx 0.06.
3
Company B: profit =100−75=25= 100 - 75 = 25, so ratio =2575≈0.33= \dfrac{25}{75} \approx 0.33.
4
Company C: profit =25−20=5= 25 - 20 = 5, so ratio =520=0.25= \dfrac{5}{20} = 0.25.
5
Company D: profit =50−40=10= 50 - 40 = 10, so ratio =1040=0.25= \dfrac{10}{40} = 0.25.
6
The lowest ratio is Company A's, about 0.06. A earns the same profit as C but on a much larger cost base of 85, so its ratio is far lower.
Why Not the Others
Company B: 0.33 is the highest ratio.
Company D: 0.25 is well above A's value.
Company C: 0.25 is well above A's value. Its profit is as small as A's (5), but its cost is only 20.
Correct Answer: A

Q14. Scatter Plot

MCQ · +3 / −1
The total number of employees lost in 2019 and 2020 was the least for:
  1. A) Company C
  2. B) Company B
  3. C) Company A
  4. D) Company D
Correct Answer
B) Company B
Step-by-step solution
📌 Core Concept
In each year, employees lost == strength at start ++ new hires −- strength at the start of the next year. Add this for 2019 and 2020 using the second plot.
🔢 Step-by-Step Solution
1
Read the start-of-year strengths and the hires. A: 150 (hires 20), 140 (hires 35), 150. B: 210 (hires 35), 240 (hires 45), 250. C: 325 (hires 45), 325 (hires 40), 325. D: 400 (hires 30), 410 (hires 35), 400. The three strengths per company are for 2019, 2020 and 2021.
2
Company A: 2019 loss =150+20−140=30= 150 + 20 - 140 = 30. 2020 loss =140+35−150=25= 140 + 35 - 150 = 25. Total 55.
3
Company B: 2019 loss =210+35−240=5= 210 + 35 - 240 = 5. 2020 loss =240+45−250=35= 240 + 45 - 250 = 35. Total 40.
4
Company C: 2019 loss =325+45−325=45= 325 + 45 - 325 = 45. 2020 loss =325+40−325=40= 325 + 40 - 325 = 40. Total 85.
5
Company D: 2019 loss =400+30−410=20= 400 + 30 - 410 = 20. 2020 loss =410+35−400=45= 410 + 35 - 400 = 45. Total 65.
6
The smallest total is 40, for Company B.
Why Not the Others
Company A: 55 is above 40.
Company C: 85 is the largest total.
Company D: 65 is above 40.
Correct Answer: B

Q15. Scatter Plot

MCQ · +3 / −1
Profit per employee is the ratio of a company's profit to its employee strength. For this purpose, the employee strength in a year is the average of the employee strength at the beginning of that year and the beginning of the next year. In 20202020 , which of the four companies had the highest profit per employee?
  1. A) Company C
  2. B) Company B
  3. C) Company A
  4. D) Company D
Correct Answer
B) Company B
Step-by-step solution
📌 Core Concept
For 2020, profit per employee =2020 profitaverage of the 2020 and 2021 start-of-year strengths= \dfrac{\text{2020 profit}}{\text{average of the 2020 and 2021 start-of-year strengths}}. Profit comes from the first plot and strength from the second.
🔢 Step-by-Step Solution
1
2020 profits (revenue minus cost): A =90−65=25= 90 - 65 = 25; B =90−40=50= 90 - 40 = 50; C =70−60=10= 70 - 60 = 10; D =20−50=−30= 20 - 50 = -30.
2
Average strengths (2020 start and 2021 start): A =140+1502=145= \dfrac{140 + 150}{2} = 145; B =240+2502=245= \dfrac{240 + 250}{2} = 245; C =325+3252=325= \dfrac{325 + 325}{2} = 325; D =410+4002=405= \dfrac{410 + 400}{2} = 405.
3
Profit per employee: A =25145≈0.17= \dfrac{25}{145} \approx 0.17; B =50245≈0.20= \dfrac{50}{245} \approx 0.20; C =10325≈0.03= \dfrac{10}{325} \approx 0.03; D =−30405≈−0.07= \dfrac{-30}{405} \approx -0.07.
4
The highest value is Company B's, about 0.20.
Why Not the Others
Company A: about 0.17, slightly below B.
Company C: about 0.03, because its profit is small and its workforce is large.
Company D: negative, since it made a loss in 2020.
Correct Answer: B
Timed Practice

Attempt the full CAT 2022 Slot 2 paper as a free mock

All three sections, 120 minutes, in the TCS iON-style simulator. Free, no sign-up.

Start Free Mock

CAT 2022 Slot 2 DILR at a Glance

Sets in this section4
Questions in this section20
Section time40 minutes
Convenor IIMIIM Bangalore

More CAT DILR Sets with Solutions