CAT 2024 Slot 3 DILR · Set 3 of 5Data InterpretationHard DifficultyQ10–Q13 · 3 MCQ + 1 TITA

CAT 2024 Slot 3 DILR Set 3: Tables (4 Questions) with Solutions

The Tables set from the official CAT 2024 Slot 3 DILR paper: the caselet, all 4 questions, the official answer key and a step-by-step solution for each. 100% free, no sign-up.

The Set: Read the Caselet First

CAT 2024 Slot 3 DILR · Questions 10–13
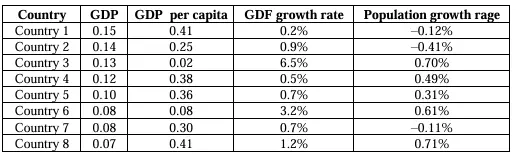
Out of 1010 countries -- Country 11 through Country 1010-- Country 99 has the highest gross domestic product (GDP), and Country 1010 has the highest GDP per capita. GDP per capita is the GDP of a country divided by its population. The table below provides the following data about Country 11 through Country 88 for the year 20242024.
Column 11 gives the country's identity.
Column 22 gives the country's GDP as a fraction of the GDP of Country 9.
Column 33 gives the country's GDP per capita as a fraction of the GDP per capita of Country10.
Column 44 gives the country's annual GDP growth rate.
Column 55 gives the country's annual population growth rate.
Assume that the GDP growth rates and population growth rates of the countries will remain constant for the next three years.
Official Reference Chart - CAT 2024 Slot 3 Official Reference Chart - CAT 2024 Slot 3

In the exam this set competed with 4 others for 40 minutes. Budget about 8 minutes if you attempt it.

Q10. Tables

MCQ · +3 / −1
Which one among the countries 1 through 8, has the smallest population in 2024?
  1. A) Country 8
  2. B) Country 5
  3. C) Country 3
  4. D) Country 7
Correct Answer
A) Country 8
Step-by-step solution
📌 Core Concept
Population = GDP ÷ GDP per capita. Both columns are fractions of fixed benchmarks (Country 9's GDP and Country 10's GDP per capita). So the ratio of column 2 to column 3 is proportional to population, and the common constants cancel when comparing countries.
🔢 Step-by-Step Solution
1
Compute GDP fractionper-capita fraction\dfrac{\text{GDP fraction}}{\text{per-capita fraction}} for each country:
Country 1: 0.15/0.41≈0.3660.15/0.41 \approx 0.366
Country 2: 0.14/0.25=0.560.14/0.25 = 0.56
Country 3: 0.13/0.02=6.50.13/0.02 = 6.5
Country 4: 0.12/0.38≈0.3160.12/0.38 \approx 0.316
Country 5: 0.10/0.36≈0.2780.10/0.36 \approx 0.278
Country 6: 0.08/0.08=10.08/0.08 = 1
Country 7: 0.08/0.30≈0.2670.08/0.30 \approx 0.267
Country 8: 0.07/0.41≈0.1710.07/0.41 \approx 0.171
2
The smallest value is 0.171, for Country 8.
Why Not the Others
Country 5 (0.278), Country 3 (6.5) and Country 7 (0.267) all have larger values than Country 8.
Correct Answer: A

Q11. Tables

MCQ · +3 / −1
The ratio of Country 4’s GDP to Country 5’s GDP in 2026 will be closest to
  1. A) 1.032
  2. B) 1.195
  3. C) 1.314
  4. D) 0.963
Correct Answer
B) 1.195
Step-by-step solution
📌 Core Concept
GDP grows at a constant annual rate, so after nn years GDP is multiplied by (1+g)n(1+g)^n. The ratio of two countries' GDPs in 2026 is the 2024 ratio times the ratio of their growth factors.
🔢 Step-by-Step Solution
1
In 2024, the ratio of Country 4's GDP to Country 5's GDP is 0.12/0.10=1.20.12/0.10 = 1.2, because both are fractions of Country 9's GDP.
2
From 2024 to 2026 is 2 years. Country 4's GDP growth is 0.5% and Country 5's is 0.7%.
3
The ratio in 2026 is 1.2×(1.0051.007)21.2 \times \left(\dfrac{1.005}{1.007}\right)^2.
4
1.0051.007≈0.99801\dfrac{1.005}{1.007} \approx 0.99801, and squaring gives about 0.996040.99604.
5
1.2×0.99604≈1.1951.2 \times 0.99604 \approx 1.195.
Why Not the Others
1.032 and 0.963 are far below 1.195. Growth rates this small cannot move 1.2 that much.
1.314 would need Country 4 to grow faster than Country 5, but its growth rate is lower.
Correct Answer: B

Q12. Tables

MCQ · +3 / −1
Which one among the countries 1, 4, 5, and 7 will have the largest population in 2027?
  1. A) Country 7
  2. B) Country 4
  3. C) Country 5
  4. D) Country 1
Correct Answer
D) Country 1
Step-by-step solution
📌 Core Concept
Population in 2024 is proportional to GDP fractionper-capita fraction\dfrac{\text{GDP fraction}}{\text{per-capita fraction}}. It then grows at each country's population growth rate for 3 years (2024 to 2027).
🔢 Step-by-Step Solution
1
The 2024 population index is 0.15/0.41≈0.3660.15/0.41 \approx 0.366 for Country 1, 0.12/0.38≈0.3160.12/0.38 \approx 0.316 for Country 4, 0.10/0.36≈0.2780.10/0.36 \approx 0.278 for Country 5 and 0.08/0.30≈0.2670.08/0.30 \approx 0.267 for Country 7.
2
Country 1 starts clearly ahead of the others.
3
Apply 3 years of growth:
Country 1 (rate −0.12%-0.12\%): 0.366×0.99883≈0.3650.366 \times 0.9988^3 \approx 0.365
Country 4 (rate 0.49%0.49\%): 0.316×1.00493≈0.3200.316 \times 1.0049^3 \approx 0.320
Country 5 (rate 0.31%0.31\%): 0.278×1.00313≈0.2800.278 \times 1.0031^3 \approx 0.280
Country 7 (rate −0.11%-0.11\%): 0.267×0.99893≈0.2660.267 \times 0.9989^3 \approx 0.266
4
Country 1 is largest at about 0.365. The growth rates are under 0.5% a year, too small to close the gap to Country 4.
Why Not the Others
Country 4 reaches only about 0.320, even with the fastest growth among the four.
Countries 5 and 7 start lower and stay lower.
Correct Answer: D

Q13. Tables

TITA · +3 / 0
For how many countries among Country 1 through Country 8 will the GDP per capita in 2027 be lower than that in 2024?
Correct Answer
0
Step-by-step solution
📌 Core Concept
GDP per capita is GDP divided by population. Its yearly growth factor is 1+GDP growth1+population growth\dfrac{1+\text{GDP growth}}{1+\text{population growth}}. Per capita falls over 3 years only if this factor is below 1, which means population growth exceeds GDP growth.
🔢 Step-by-Step Solution
1
Compare each country's GDP growth with its population growth:
Country 1: 0.2%0.2\% vs −0.12%-0.12\%, so GDP grows faster.
Country 2: 0.9%0.9\% vs −0.41%-0.41\%, so GDP grows faster.
Country 3: 6.5%6.5\% vs 0.70%0.70\%, so GDP grows faster.
Country 4: 0.5%0.5\% vs 0.49%0.49\%, so GDP grows faster, narrowly.
Country 5: 0.7%0.7\% vs 0.31%0.31\%, so GDP grows faster.
Country 6: 3.2%3.2\% vs 0.61%0.61\%, so GDP grows faster.
Country 7: 0.7%0.7\% vs −0.11%-0.11\%, so GDP grows faster.
Country 8: 1.2%1.2\% vs 0.71%0.71\%, so GDP grows faster.
2
In every case the growth factor exceeds 1. For example, Country 4 has 1.005/1.0049>11.005/1.0049 > 1.
3
Per capita therefore rises for all eight countries, and none has a lower value in 2027 than in 2024.
Quick Check
The tightest case is Country 4, where 0.5%>0.49%0.5\% > 0.49\%. Even there the 2027 per capita is slightly higher.
Correct Answer: 0
Timed Practice

Attempt the full CAT 2024 Slot 3 paper as a free mock

All three sections, 120 minutes, in the TCS iON-style simulator. Free, no sign-up.

Start Free Mock

CAT 2024 Slot 3 DILR at a Glance

Sets in this section5
Questions in this section22
Section time40 minutes
Convenor IIMIIM Calcutta

More CAT DILR Sets with Solutions