
Q14. Scatter Plot
MCQ · +3 / −1
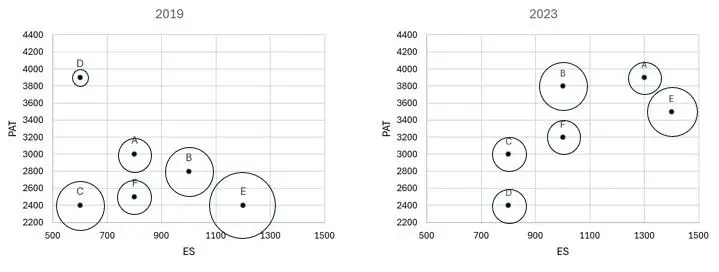
Assume that the annual rate of growth in PAT over the previous year (ARG) remained constant over the years for each of the six firms. Which among the firms A, B, C, and E had the highest ARG?
- A) Firm E
- B) Firm B
- C) Firm A
- D) Firm C
Correct Answer
A) Firm E
Step-by-step solution
📌 Core Concept
With a constant annual growth rate, the 4-year PAT ratio (2019 to 2023) is . The firm with the largest ratio has the highest ARG, so only the PAT readings from the two plots are needed.
🔢 Step-by-Step Solution
1
Read PAT for each firm from the vertical axis of the two plots. Firm A went from 3000 to 3900, Firm B from 2800 to 3800, Firm C from 2400 to 3000, and Firm E from 2400 to 3500.
2
Compute the 4-year growth ratio for each firm.
3
Firm A: .
4
Firm B: .
5
Firm C: .
6
Firm E: .
7
All four firms span the same 4 years, so the largest ratio gives the largest . Firm E has the largest ratio at about 1.46, so it has the highest ARG.
Why Not the Others
Firm B: ratio is about 1.36, below E's 1.46.
Firm A: ratio is 1.30, below E's.
Firm C: ratio is 1.25, the lowest of the four.
Quick Check
Firm E's ratio of 1.46 gives a year. Firm B's ratio of 1.36 gives a year.
Correct Answer: A