CAT 2025 Slot 2 DILR · Set 5 of 5Data InterpretationHard DifficultyQ19–Q22 · 1 MCQ + 3 TITA

CAT 2025 Slot 2 DILR Set 5: Scatter Plot (4 Questions) with Solutions

The Scatter Plot set from the official CAT 2025 Slot 2 DILR paper: the caselet, all 4 questions, the official answer key and a step-by-step solution for each. 100% free, no sign-up.

The Set: Read the Caselet First

CAT 2025 Slot 2 DILR · Questions 19–22
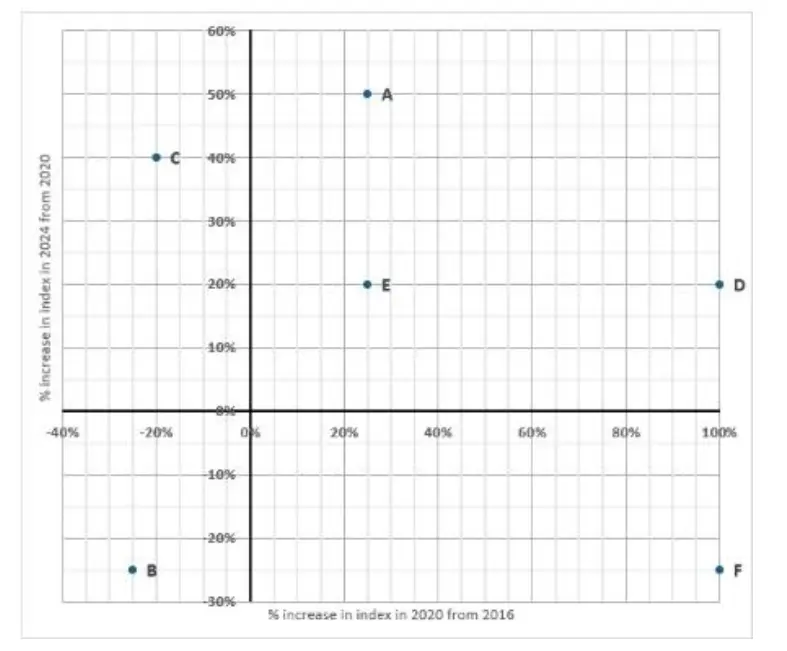
The Sustainability Index (SI) of a country at a point in time is an integer between 1 and 100. This question is related to SI of six countries - A, B, C, D, E, and F - at three different points in time - 2016, 2020, and 2024. The plot represents the exact changes in their SI, with X-coordinate representing % increase in 2020 from 2016, i.e., (SI in 2020 minus SI in 2016) / (SI in 2016), and Y-coordinate representing % increase in 2024 from 2020. At any point in time, the country with highest SI is ranked 1, while the country with the lowest SI is ranked 6. The following additional facts are known.
1
In 2016, B, C, E, and A had ranks 1, 2, 3, and 4 respectively.
2
F had lower SI than any other country in 2016, 2020, and 2024.
3
In 2024, E was the only country with SI of 90.
4
The range of SI of the six countries was 60 in 2016 as well as in 2024.
Official Reference Chart - CAT 2025 Slot 2 Official Reference Chart - CAT 2025 Slot 2

In the exam this set competed with 4 others for 40 minutes. Budget about 8 minutes if you attempt it.

Q19. Scatter Plot

TITA · +3 / 0
What was the SI of E in 2016?
Correct Answer
60
Step-by-step solution
📌 Core Concept
The plot gives growth multipliers for each country. Working back from E's known 2024 SI of 90 gives its earlier values.
🔢 Step-by-Step Solution
1
E sits at (25%,20%)(25\%, 20\%), so its SI was multiplied by 1.251.25 from 2016 to 2020 and by 1.201.20 from 2020 to 2024.
2
Fact 3 gives E a 2024 SI of 90.
3
The 2020 SI of E is 90÷1.2=7590 \div 1.2 = 75.
4
The 2016 SI of E is 75÷1.25=6075 \div 1.25 = 60.
Quick Check
60×1.25×1.2=9060 \times 1.25 \times 1.2 = 90, which matches Fact 3.
Correct Answer: 60

Q20. Scatter Plot

TITA · +3 / 0
What was the SI of F in 2020?
Correct Answer
40
Step-by-step solution
📌 Core Concept
B and F are the highest and lowest in 2016, so their gap is the range of 60. Integer SI values and the plotted growth rates then fix F.
🔢 Step-by-Step Solution
1
From the plot, the multipliers for 2016→2020→2024 are: B 0.75,0.750.75, 0.75 (net 9/169/16); F 2,0.752, 0.75 (net 1.51.5); C 0.8,1.40.8, 1.4 (net 1.121.12); E 1.25,1.21.25, 1.2.
2
Facts 1 and 2 make B the highest and F the lowest in 2016. Fact 4 then gives B16−F16=60B_{16} - F_{16} = 60.
3
B's 2024 SI is 916B16\frac{9}{16}B_{16}, so B16B_{16} must be a multiple of 16. The possible values are 64, 80 and 96, giving F16=4,20,36F_{16} = 4, 20, 36.
4
E is 60 in 2016 (from Fact 3). C ranks 2nd, so 60<C16<B1660 < C_{16} < B_{16}. Also C24=1.12 C16=2825C16C_{24} = 1.12\,C_{16} = \frac{28}{25}C_{16} must be an integer, so C16C_{16} is a multiple of 25. The only such value above 60 is 75, which rules out B16=64B_{16} = 64.
5
If B16=96B_{16} = 96, then F24=1.5×36=54F_{24} = 1.5 \times 36 = 54. The 2024 range of 60 would need a maximum of 114, which is impossible. So B16=80B_{16} = 80 and F16=20F_{16} = 20.
6
F's 2020 SI is 20×2=4020 \times 2 = 40.
Quick Check
F24=40×0.75=30F_{24} = 40 \times 0.75 = 30 and E24=90E_{24} = 90, so the 2024 range is 6060, as Fact 4 requires.
Correct Answer: 40

Q21. Scatter Plot

TITA · +3 / 0
What was the SI of C in 2024?
Correct Answer
84
Step-by-step solution
📌 Core Concept
C's 2024 SI is its 2016 SI times the net multiplier from the plot. Integer values and the rank clues fix C's 2016 SI.
🔢 Step-by-Step Solution
1
C sits at (−20%,40%)(-20\%, 40\%), so the net multiplier is 0.8×1.4=1.12=28250.8 \times 1.4 = 1.12 = \frac{28}{25}.
2
C24C_{24} is an integer, so C16C_{16} must be a multiple of 25.
3
Fact 1 ranks B first, C second and E third in 2016. E's 2016 SI is 60 (from its 2024 SI of 90, as in the first question), so 60<C16<B1660 < C_{16} < B_{16}.
4
B's 2016 SI is 80 (derived from the range clue and integer constraints). The only multiple of 25 between 60 and 80 is 75.
5
C24=75×1.12=84C_{24} = 75 \times 1.12 = 84.
Quick Check
C's values are 75, 60, 84. 84 is below E's 90, which is consistent with E being the only country at 90 in 2024.
Correct Answer: 84

Q22. Scatter Plot

MCQ · +3 / −1
What was the SI of B in 2024?
  1. A) 54
  2. B) 60
  3. C) 45
  4. D) 80
Correct Answer
C) 45
Step-by-step solution
📌 Core Concept
B's 2024 SI is its 2016 SI times the net multiplier from the plot. The 2016 range of 60 and the integer constraints fix B's 2016 SI.
🔢 Step-by-Step Solution
1
B sits at (−25%,−25%)(-25\%, -25\%), so the net multiplier is 0.75×0.75=9160.75 \times 0.75 = \frac{9}{16}.
2
Facts 1 and 2 make B the highest and F the lowest in 2016, so B16−F16=60B_{16} - F_{16} = 60 by Fact 4.
3
B24B_{24} is an integer, so B16B_{16} is a multiple of 16. The possible values are 64, 80 and 96, giving F16=4,20,36F_{16} = 4, 20, 36.
4
C ranks 2nd in 2016, so 60<C16<B1660 < C_{16} < B_{16}. C16C_{16} must also be a multiple of 25, because C24=1.12 C16C_{24} = 1.12\,C_{16} is an integer. That forces C16=75C_{16} = 75 and rules out B16=64B_{16} = 64.
5
If B16=96B_{16} = 96, then F24=1.5×36=54F_{24} = 1.5 \times 36 = 54. The 2024 range of 60 would need a maximum of 114, which is impossible. So B16=80B_{16} = 80.
6
B24=80×916=45B_{24} = 80 \times \frac{9}{16} = 45.
Why Not the Others
A) 54 is not 916\frac{9}{16} of any admissible B16B_{16}.
B) 60 is B's 2020 SI (80×0.7580 \times 0.75), not its 2024 SI.
D) 80 is B's 2016 SI.
Correct Answer: C
Timed Practice

Attempt the full CAT 2025 Slot 2 paper as a free mock

All three sections, 120 minutes, in the TCS iON-style simulator. Free, no sign-up.

Start Free Mock

CAT 2025 Slot 2 DILR at a Glance

Sets in this section5
Questions in this section22
Section time40 minutes
Convenor IIMIIM Kozhikode

More CAT DILR Sets with Solutions